Will technology enable new approaches to preserving the look and feel of our communities? How should technology interact with the preservation of history in our cities?
A New Kind of Hospital Room
Alan Waxman
Mainstreaming Preservation
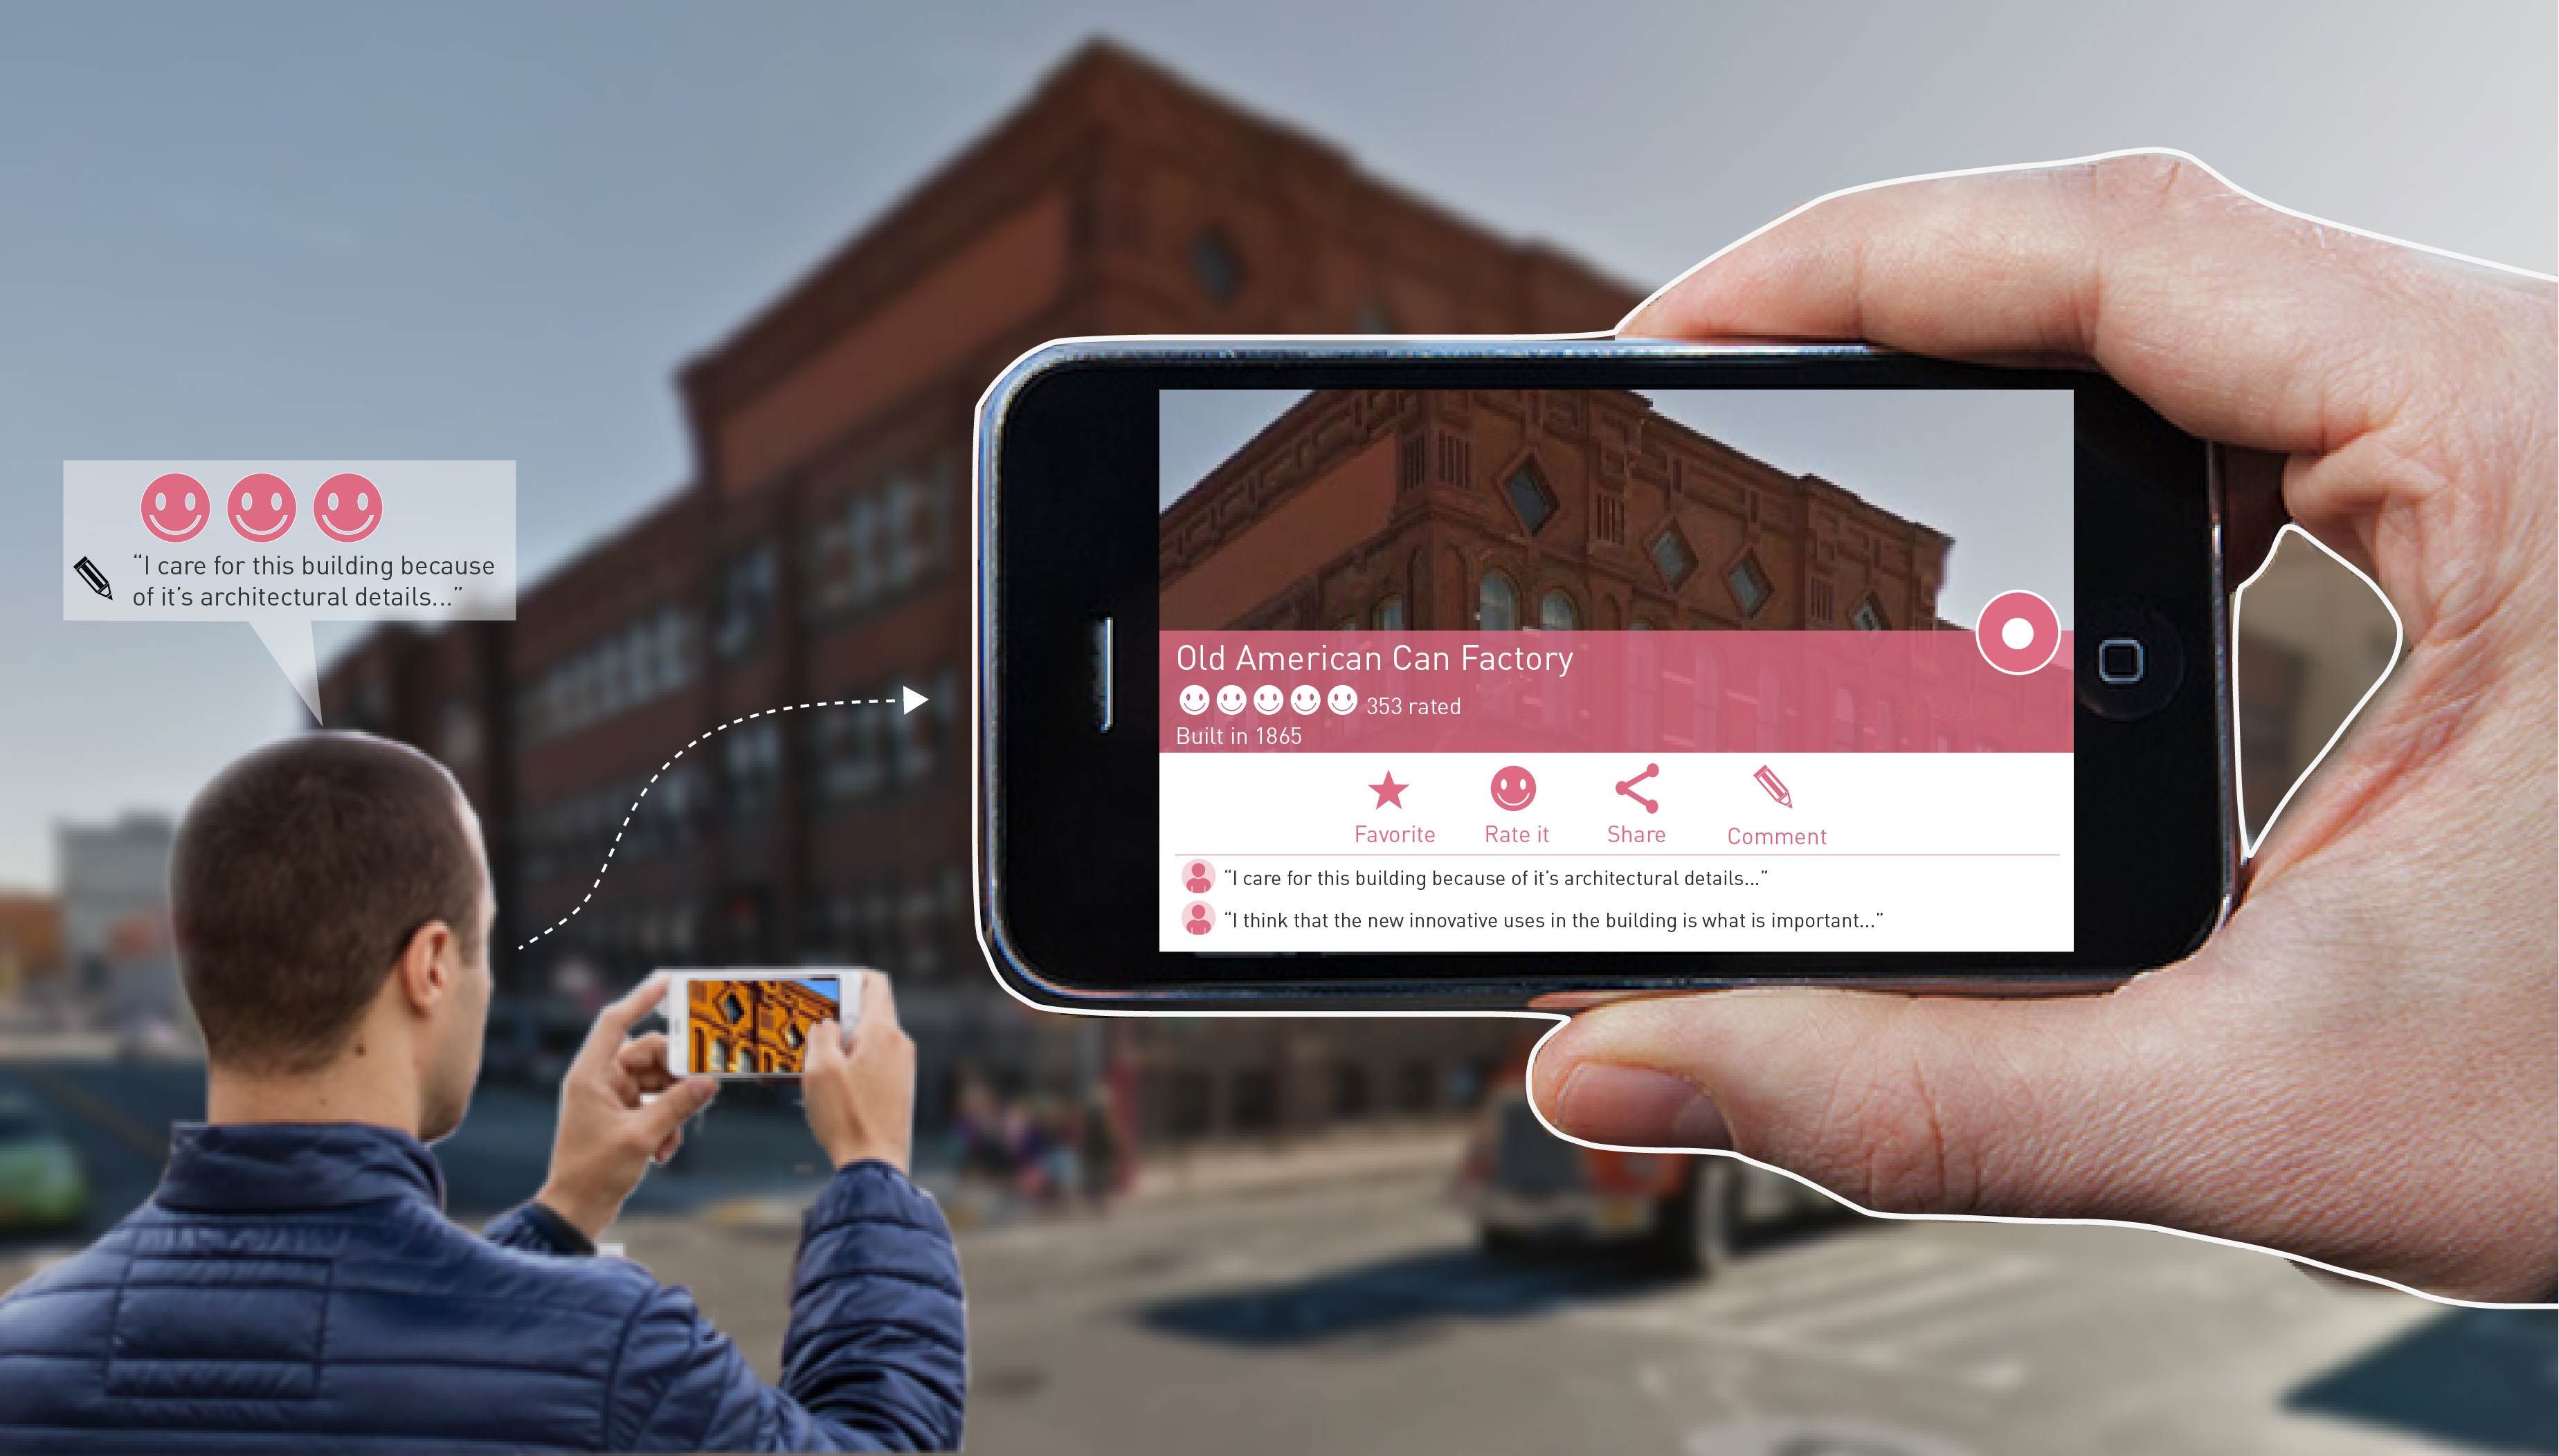
Google Maps Community Preservation Layer sketch
A recent article in the Guardian analyzed how technology could potentially make urban planning processes more transparent to the general public. In the article, a myriad of tools are mentioned- such as the CitySwipe and Flux Metro which bring future or proposed changes to a particular neighborhood or site to people’s fingertips for preview. Most of these tools aim to let residents comment or vote on proposed developments around their neighborhood. The article alludes to these tools being the Tinder of urban planning- imagine a tool where anyone could swipe right or left to approve or veto new developments in their neighborhood. One particular tool, UrbanPlanAR platform, even makes use of virtual reality so people can have an idea of what a specific project will look like within its real life context.
In New York City, the amount of apps and tools built to better understand or interact with the built environment is growing. From the city-sponsored competition Big Apps, through New York Public Library Lab’s, OldNYC to maps featured in multiple news outlets, such as the shadow map recently posted in the New York Times. In this context, where we interact and operate in a city constantly evolving and changing at a rapid pace, where market forces stretch the limit of zoning and building codes, and the Department of City Planning, the Department of Landmark Preservation and other government agencies struggle to keep pace- what is the role for preservation? And, most importantly, how can the practice of historic preservation benefit from the use of technology, data, and readily available tools such as Google maps?
Historic preservation – or preservation as it is now more commonly referred to- is now moving away from historical or cultural preservation, to the preservation of neighborhood character.
Preservation is often understood as the practice that aims to protect, preserve, and conserve buildings, landscapes, or other elements that have historical significance. This proposal aims to expand the discussion as it relates to technology, people, and how we interact with our built environment. For this purpose we propose a new Google Maps Community Preservation Layer that allows communities to easily identify and document the buildings and uses they would like to preserve in their neighborhoods. Data can be gathered just as reviews and other data is gathered today in Google Maps – by people inputting their comments and ratings into a pre-established questionnaire format. Since no two sites are alike and no two communities are alike, we propose a framework that it is flexible enough to allow for communities to adjust the questions and data that would come out of it. As communities engage in this process, they generate the type of questions that would be useful for them. By being able to ask the right questions and having user-created content, preservation is taken out of the professional world and into the hands of concerned/interested citizens.
Our proposed Google Maps Community Preservation Layer has the potential to redefine preservation processes and allow communities to define what their neighborhood character is and what assets are valuable to them. It can also change the way historic preservation is practiced today, and it could even shift traditional roles by placing an apparent responsibility on residents and community groups to make a case for their own historic preservation approach.
Google Maps Community Preservation Layer: Preservation at your fingertips
In today’s Google Map experience, places of interest are highlighted as commercial corridors and visualized in a different color. The Google Community Preservation Layer uses these same visual treatment to highlight certain areas of interest and allow users the ability to comment on particular places and buildings.
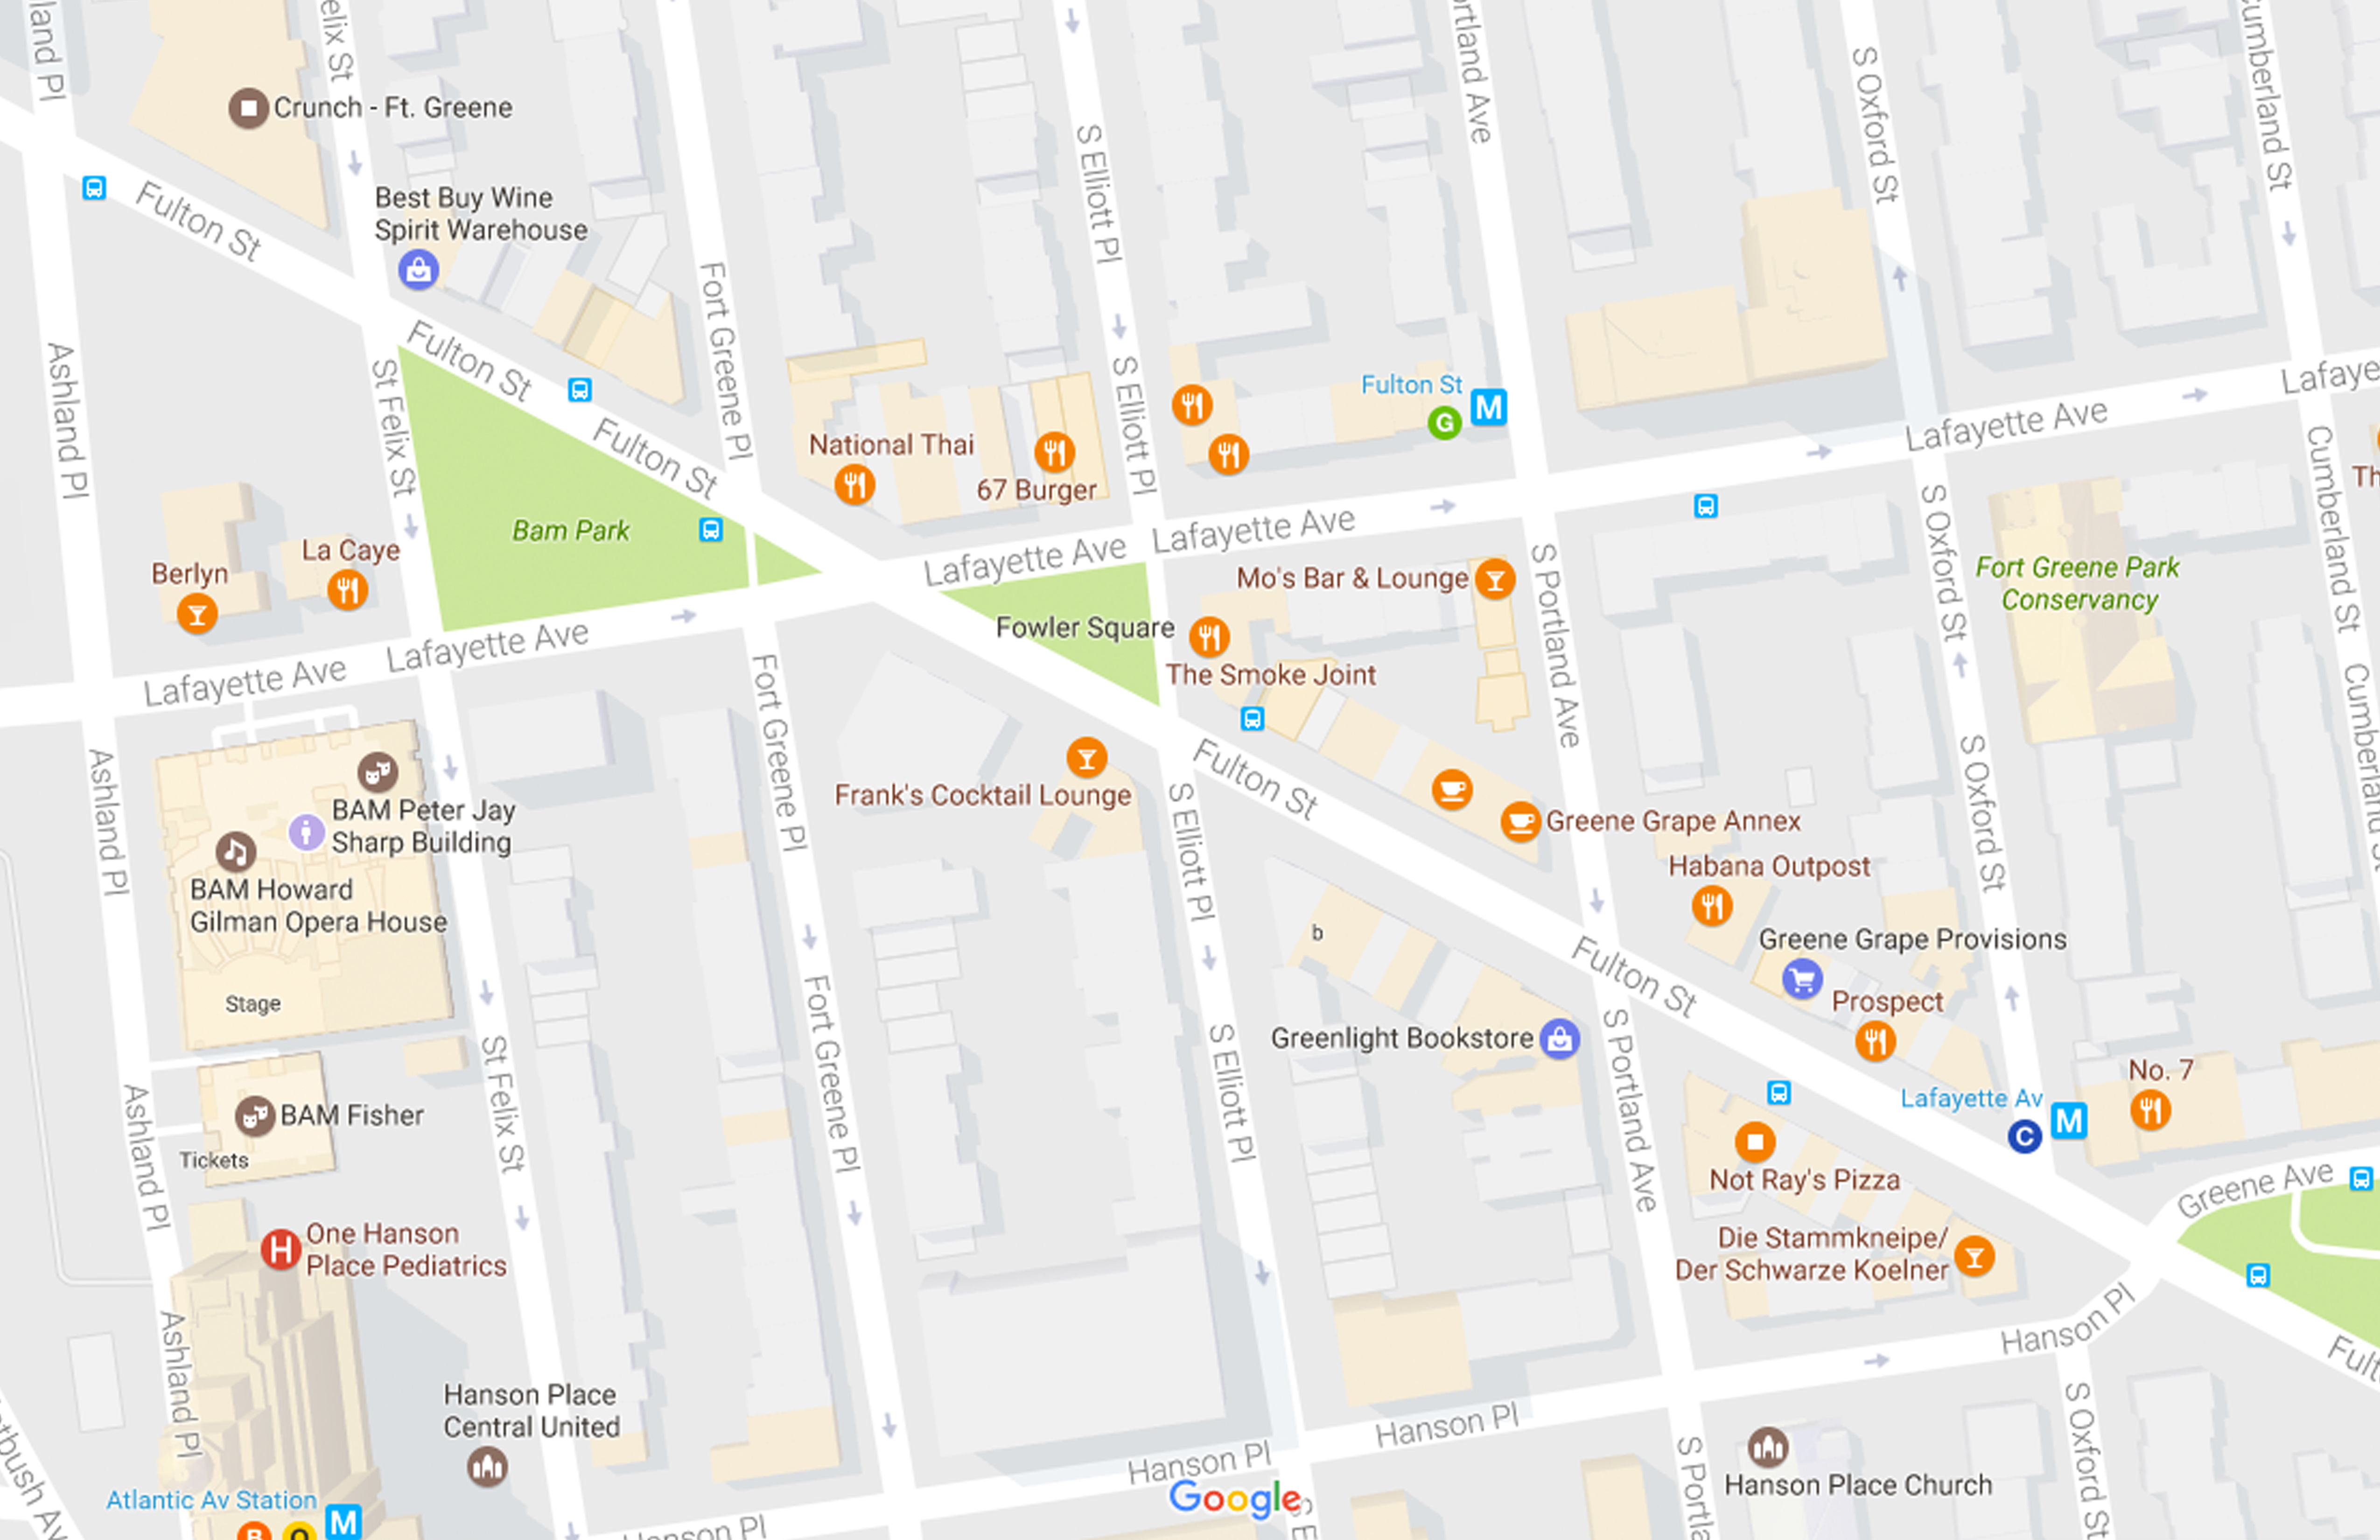
Google Maps image showing Fulton Street and Lafayette Ave area in Brooklyn with areas of interest highlighted in beige
The Community Preservation Layer can be activated following these steps:
- A decision by a community group and/or other stakeholders that a certain area warrants preservation or seems threatened by rapid development
- An area of interest for community preservation is defined on the map and the community preservation layer is activated on Google Maps
- As information is collected, it lives in Google Maps and anyone browsing on Google Maps or visiting those neighborhoods could have a glimpse at how those communities view themselves and what elements are important for them
- Once an area of preservation has been defined, and a community group has tailored the questionnaire to their needs, visitors and online browsers can input a review and rate forms or uses important to them as well
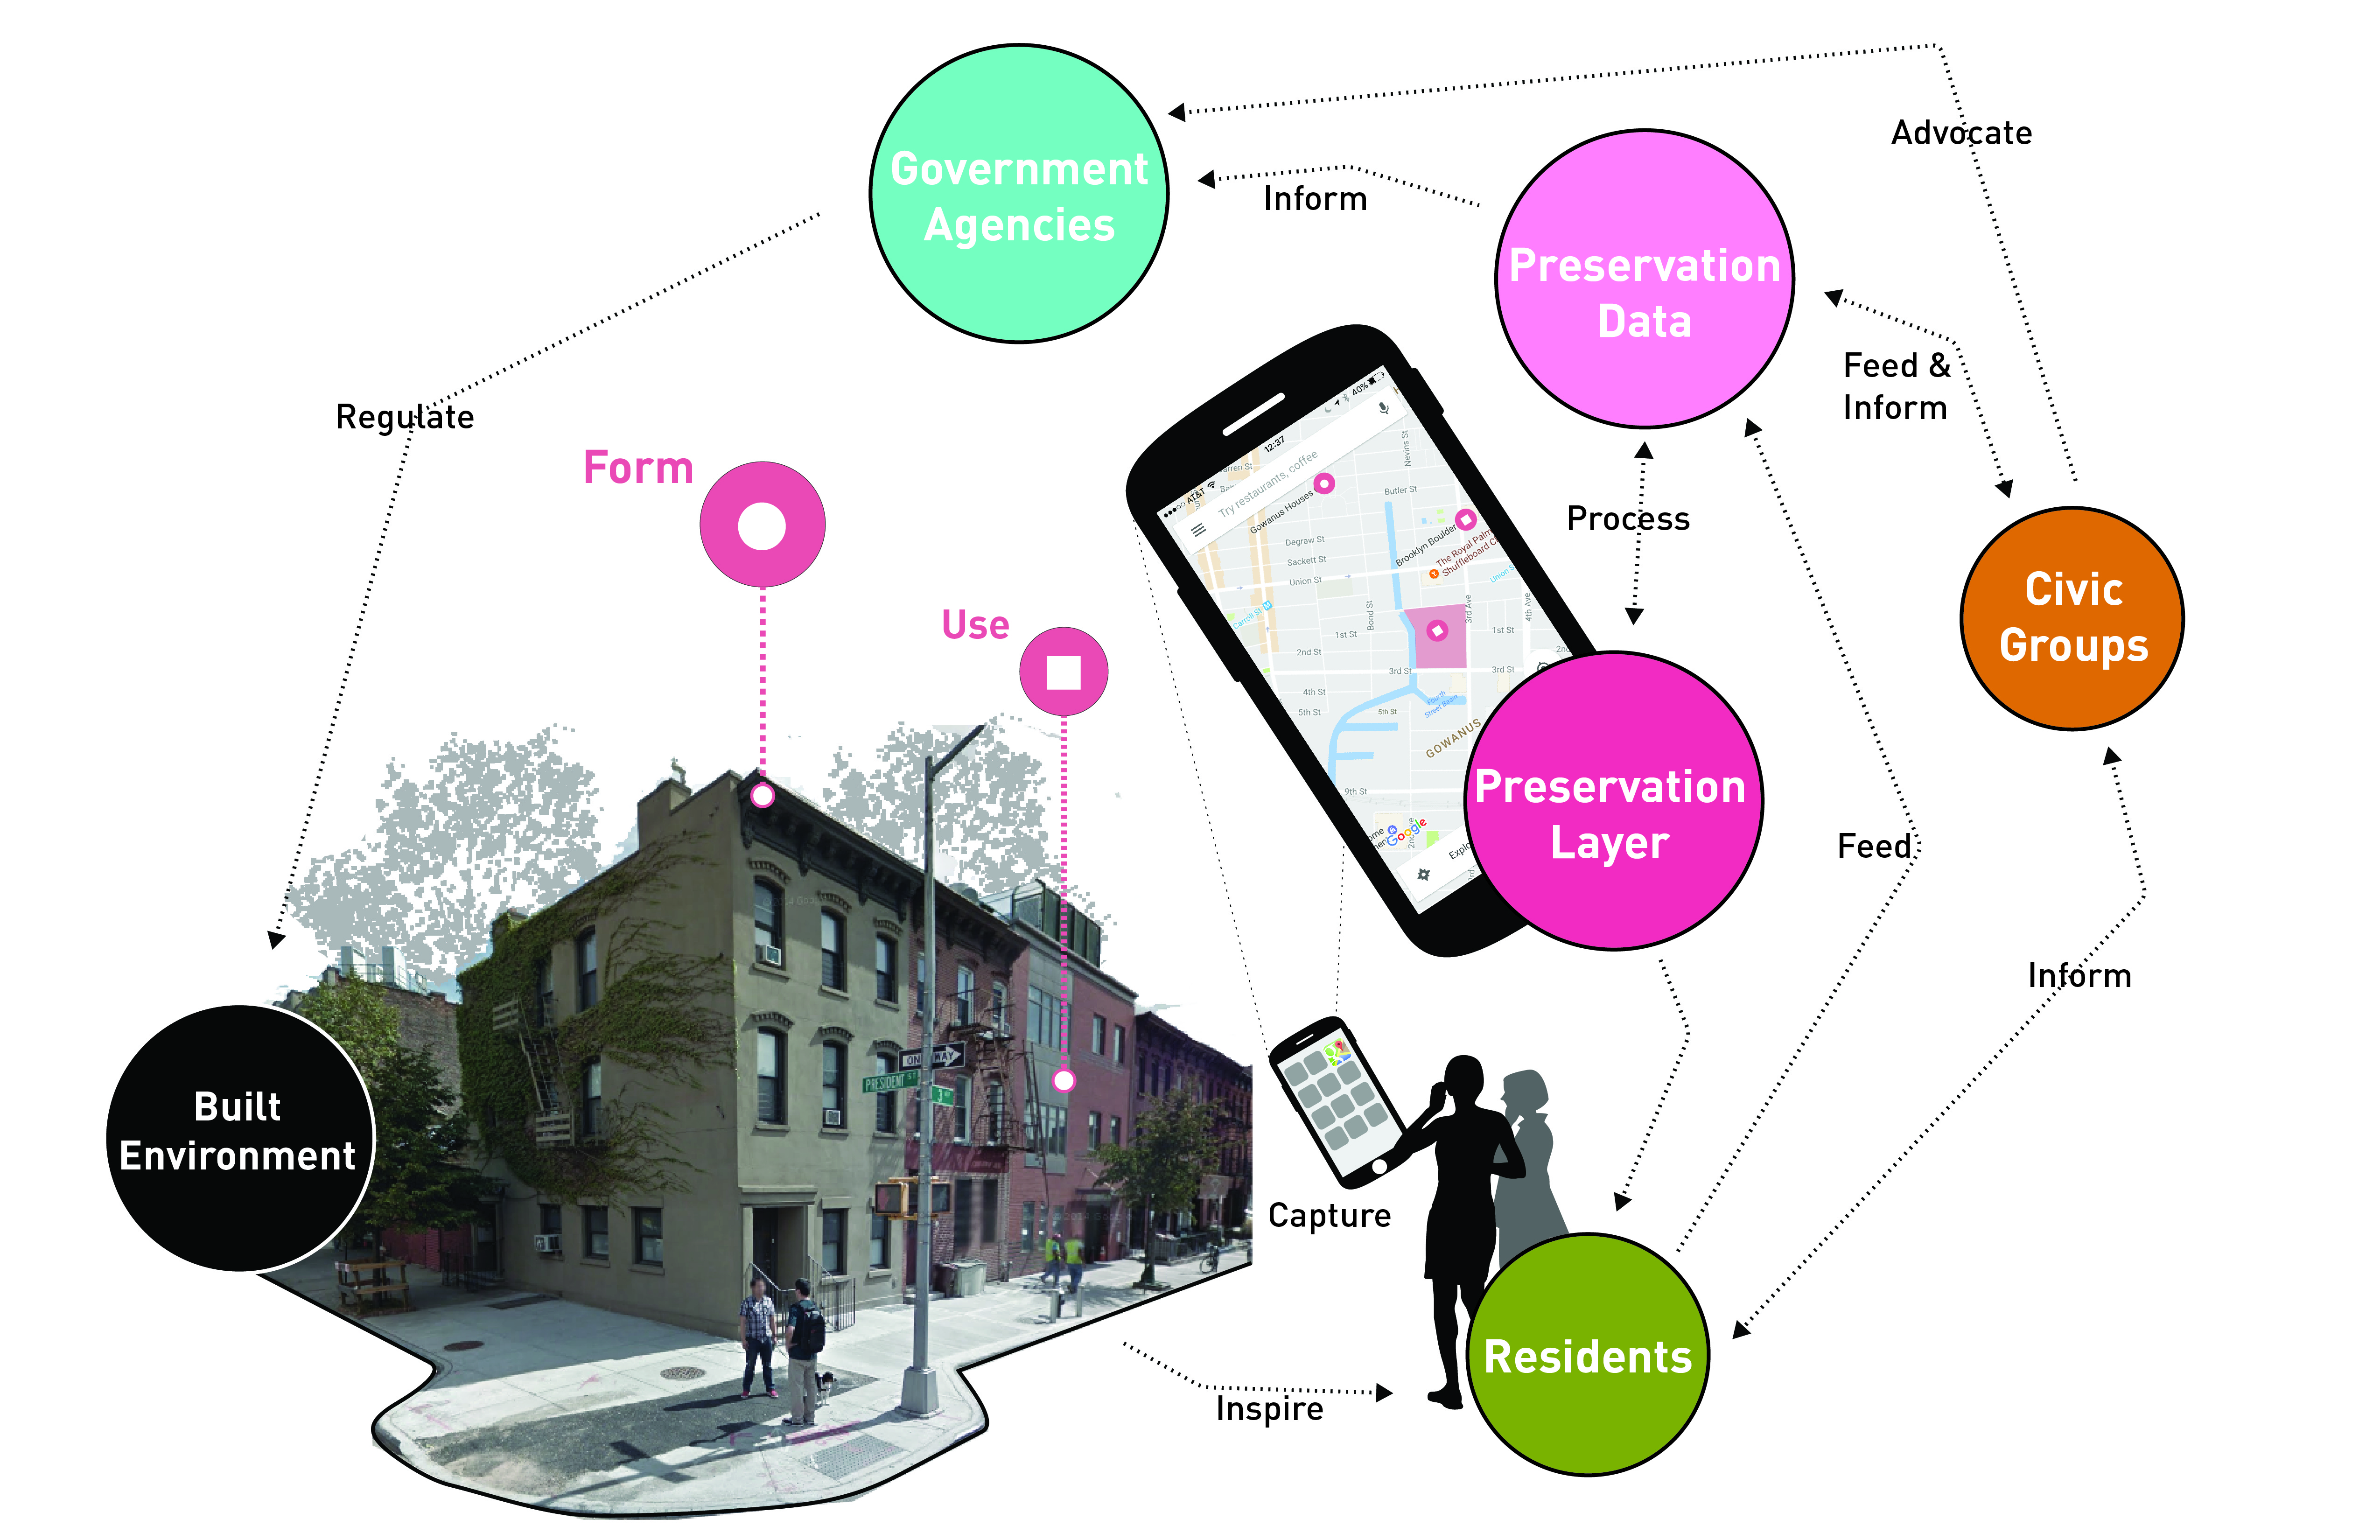
Google Maps Preservation Layer process and stakeholder map
The Google Map Community Preservation Layer would allow for communities to easily gather and/or identify the buildings, uses, or economics they like in their neighborhoods. It is flexible enough to let communities tailor their inquiries and data collection methods to reflect what they care the most about and what they think makes their community special– in some cases it will be about the built environment, in others it could be about the possibilities enabled by the urban configuration, in yet other cases it could be about the affordability or an existing employment network.
Building off the Google Maps traits, this layer could serve as an example of how existing technology can be leveraged to promote preservation, collect data on the ground, and allow communities –or other users- to input and in turn, use relevant data.
Case Study: Gowanus
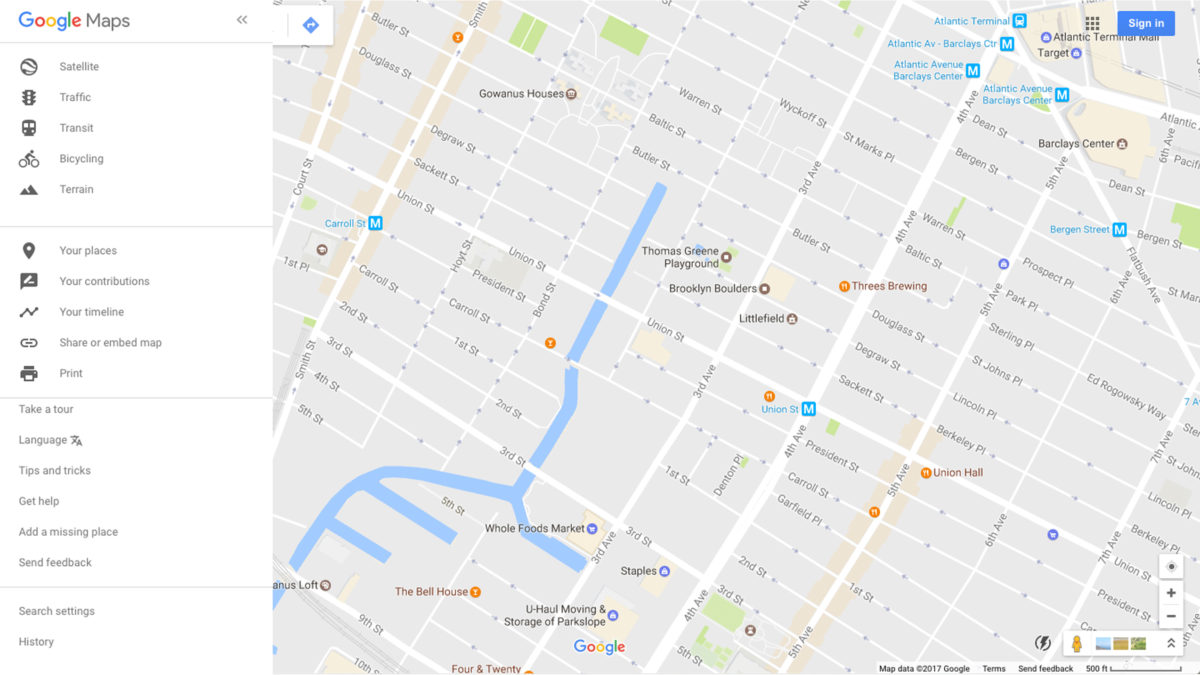
Google Maps as it is illustrates the Gowanus Canal area today
The Gowanus neighborhood in Brooklyn is undergoing rapid change. A recently completed community driven plan, called “Bridging Gowanus” together with a recently launched Neighborhood Planning Study by the NYC Department of City Planning has spurred some speculations as to the future of the neighborhood. There are many civic and community organizations operating in Gowanus with multiple agendas and visions on what they would like to see happen in the future. So how can these organizations collaborate and conduct outreach in a more streamlined manner? How can they reach more residents? How can they communicate with other city and state agencies on what is most important to constituents? How can they shape the changing future without running the risk of stifling future growth of the neighborhood? The Google Map Community Preservation Layer can help multiple stakeholders have a source of information that is collective and easy to access.
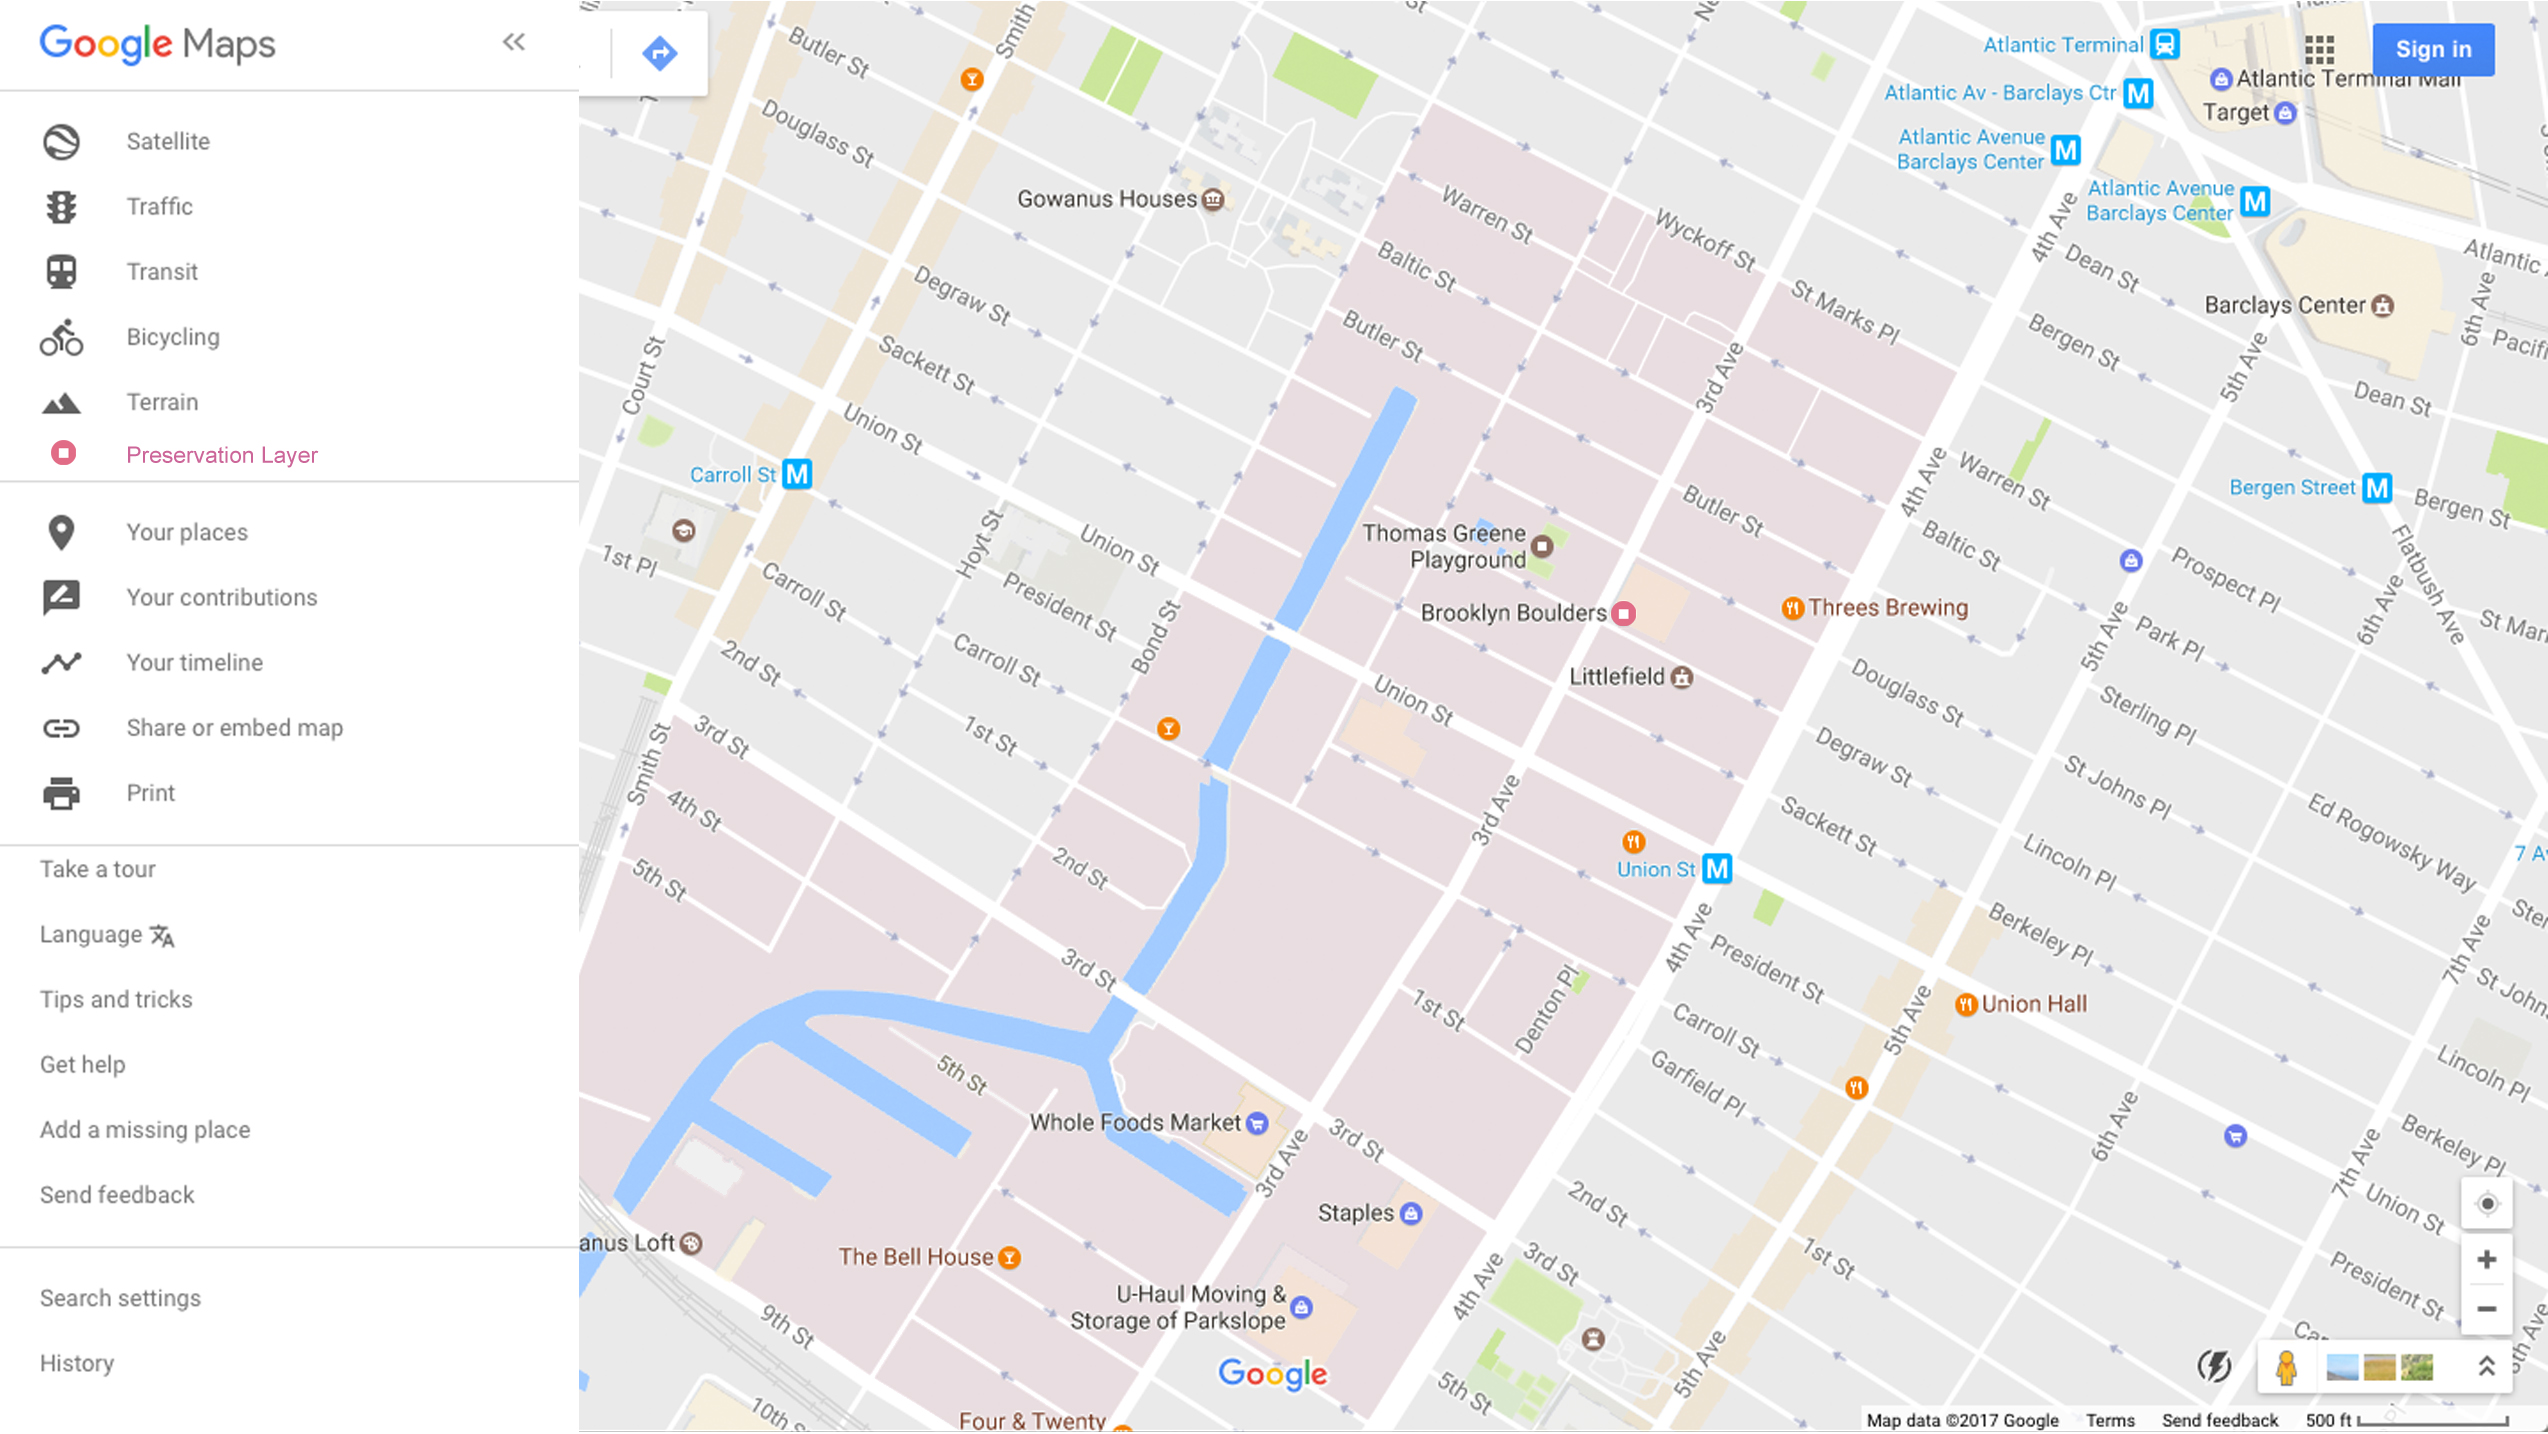
Gowanus on Google Maps with the Preservation Layer activated
In the image above, a “community preservation” area is shown in light red just like current commercial areas of are shown is light beige. This layer could be turned on and off on the left navigation bar. This area in pink can be highlighted to reflect the community’s priorities as they relate to historic preservation and neighborhood character.
Preserving form through collective choice
The BRT powerhouse, built in 1902, also known as the “Bat Cave” was once the home of the former Brooklyn Rapid Transit Powerhouse. It was a coal-fired plant that powered Brooklyn’s trolley system. The building has been abandoned since the turn of the 21st century and has housed squatters and celebrated graffiti.
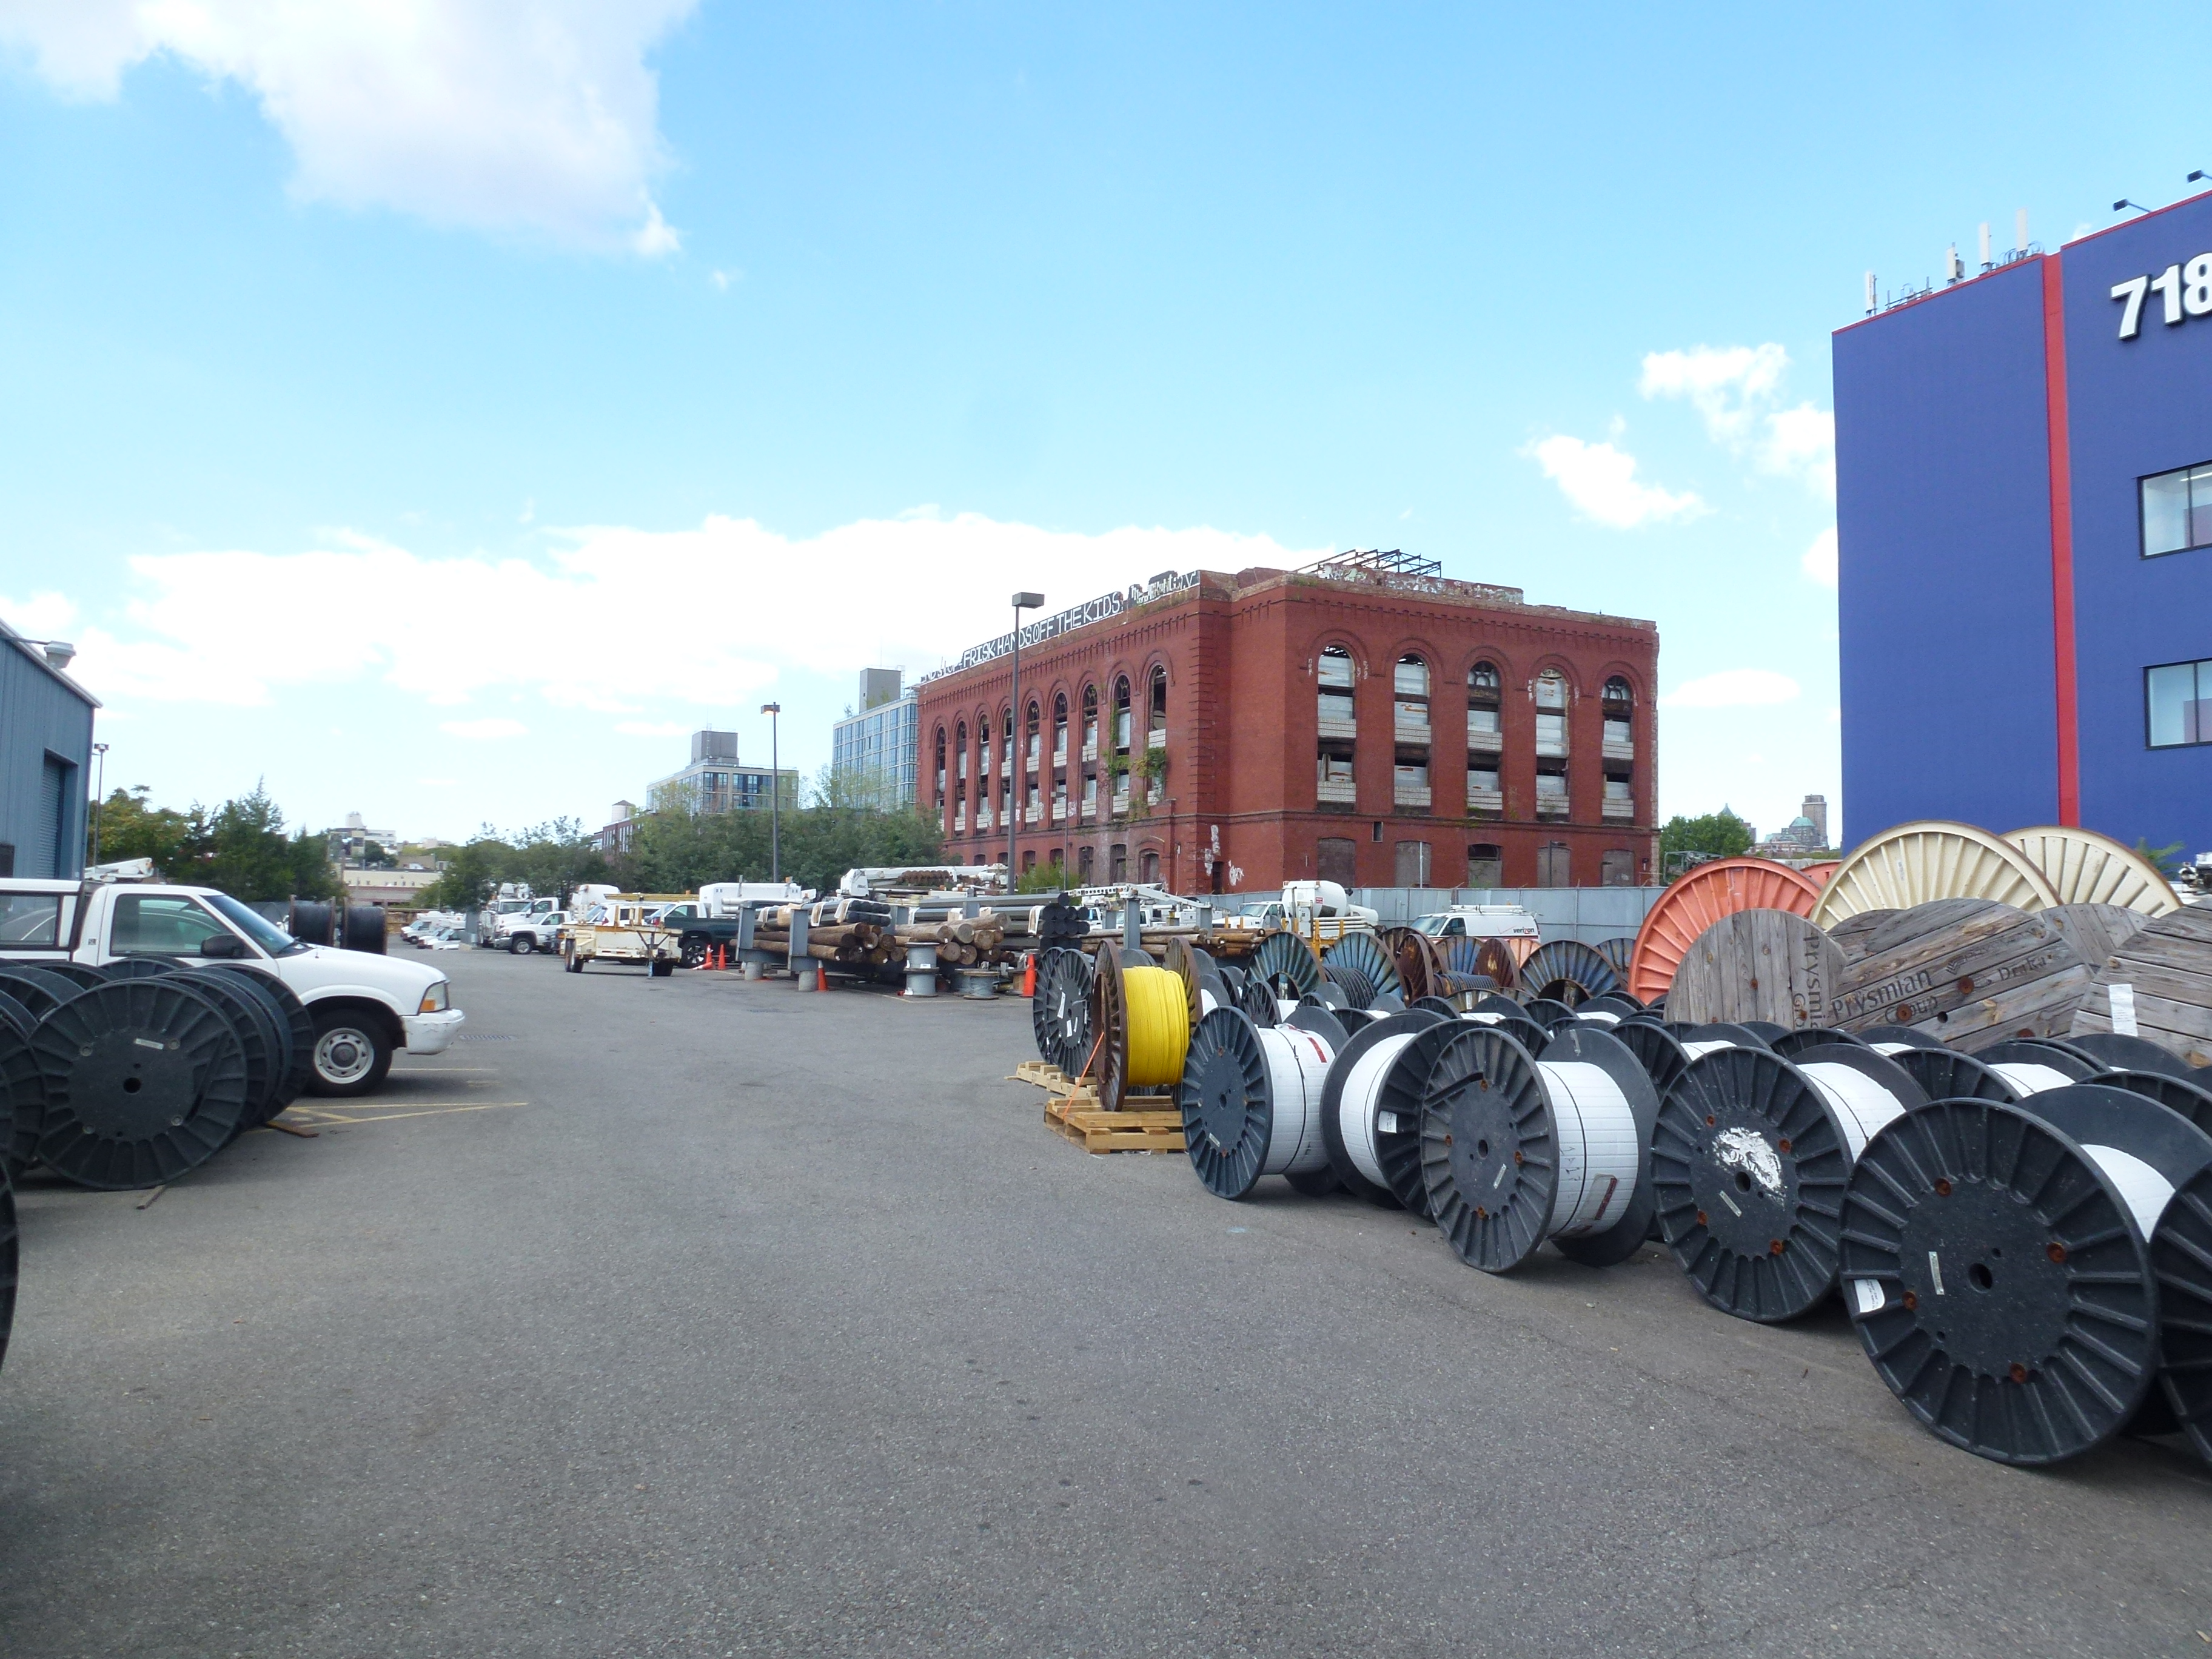
BRT Powerhouse, September 2016
It is a very prominent building in Gowanus and is considered by the community as an asset to be reused for a community benefit. In recent years there has been much speculation about the feasibility of the building’s future. However, this information is only available to those who specifically know about the history or are searching specifically for the subject matter. When searching in Google Maps, there is no indication of the historic significance of the building.
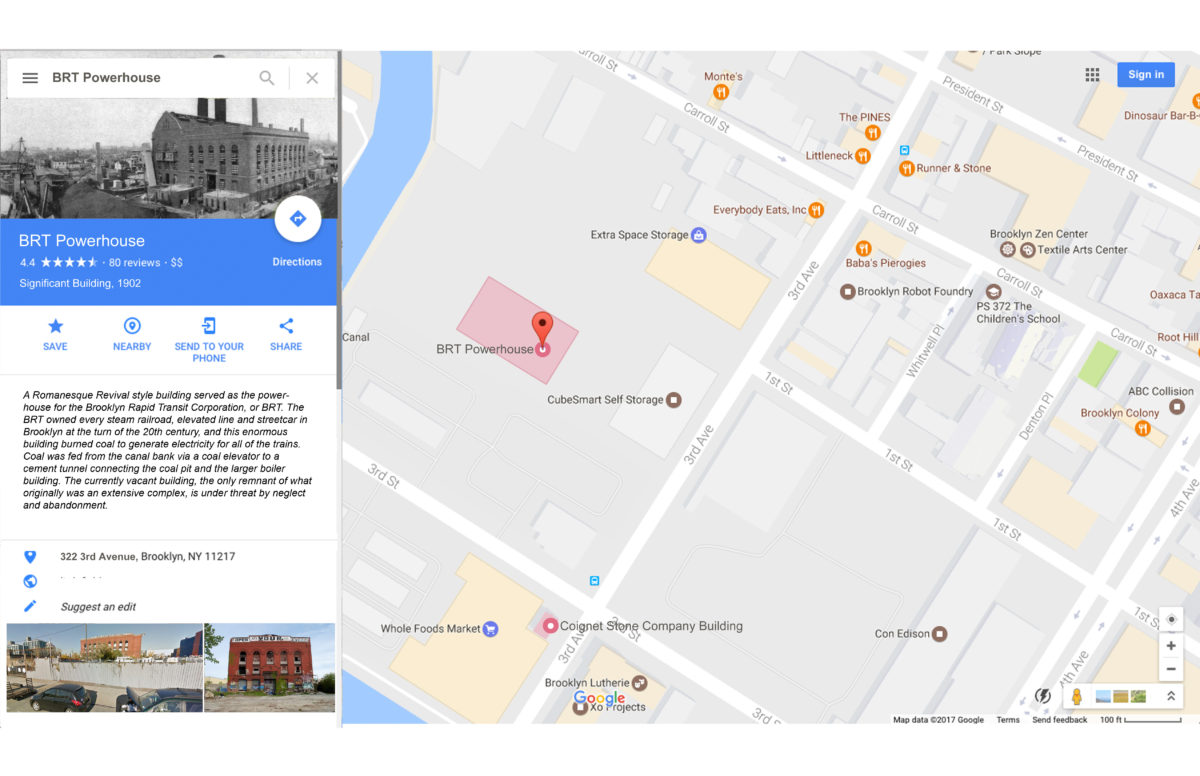
Google Maps Community Preservation Layer on: The BRT Powerhouse (highlighted) is now a Google Maps entry with information and rating as to its history and importance to residents
With the proposed tool, an organization like The Historic District Council for example, who included Gowanus and more specifically the BRT Powerhouse building in their Six to Celebrate Program, can now spread the word and include the building in a newly created Community Preservation Layer where they can upload historic images of the building, have the public rate it based on certain attributes, ask for a vote to save it and include links to relevant sites. More recent updates on the possible development of this site include an article in the NY times which revealed that the building will be renovated and expanded to house “a factory for the production of art” could also be incorporated into the newly created entry. Through this layer residents and community groups can now comment on the potential future use of the BRT Powerhouse and advocate for changes in the proposed scheme. The inclusion of these types of entries could also help residents learn more about their neighborhood and what their neighbors care most about.
Preserving programs through collective choice
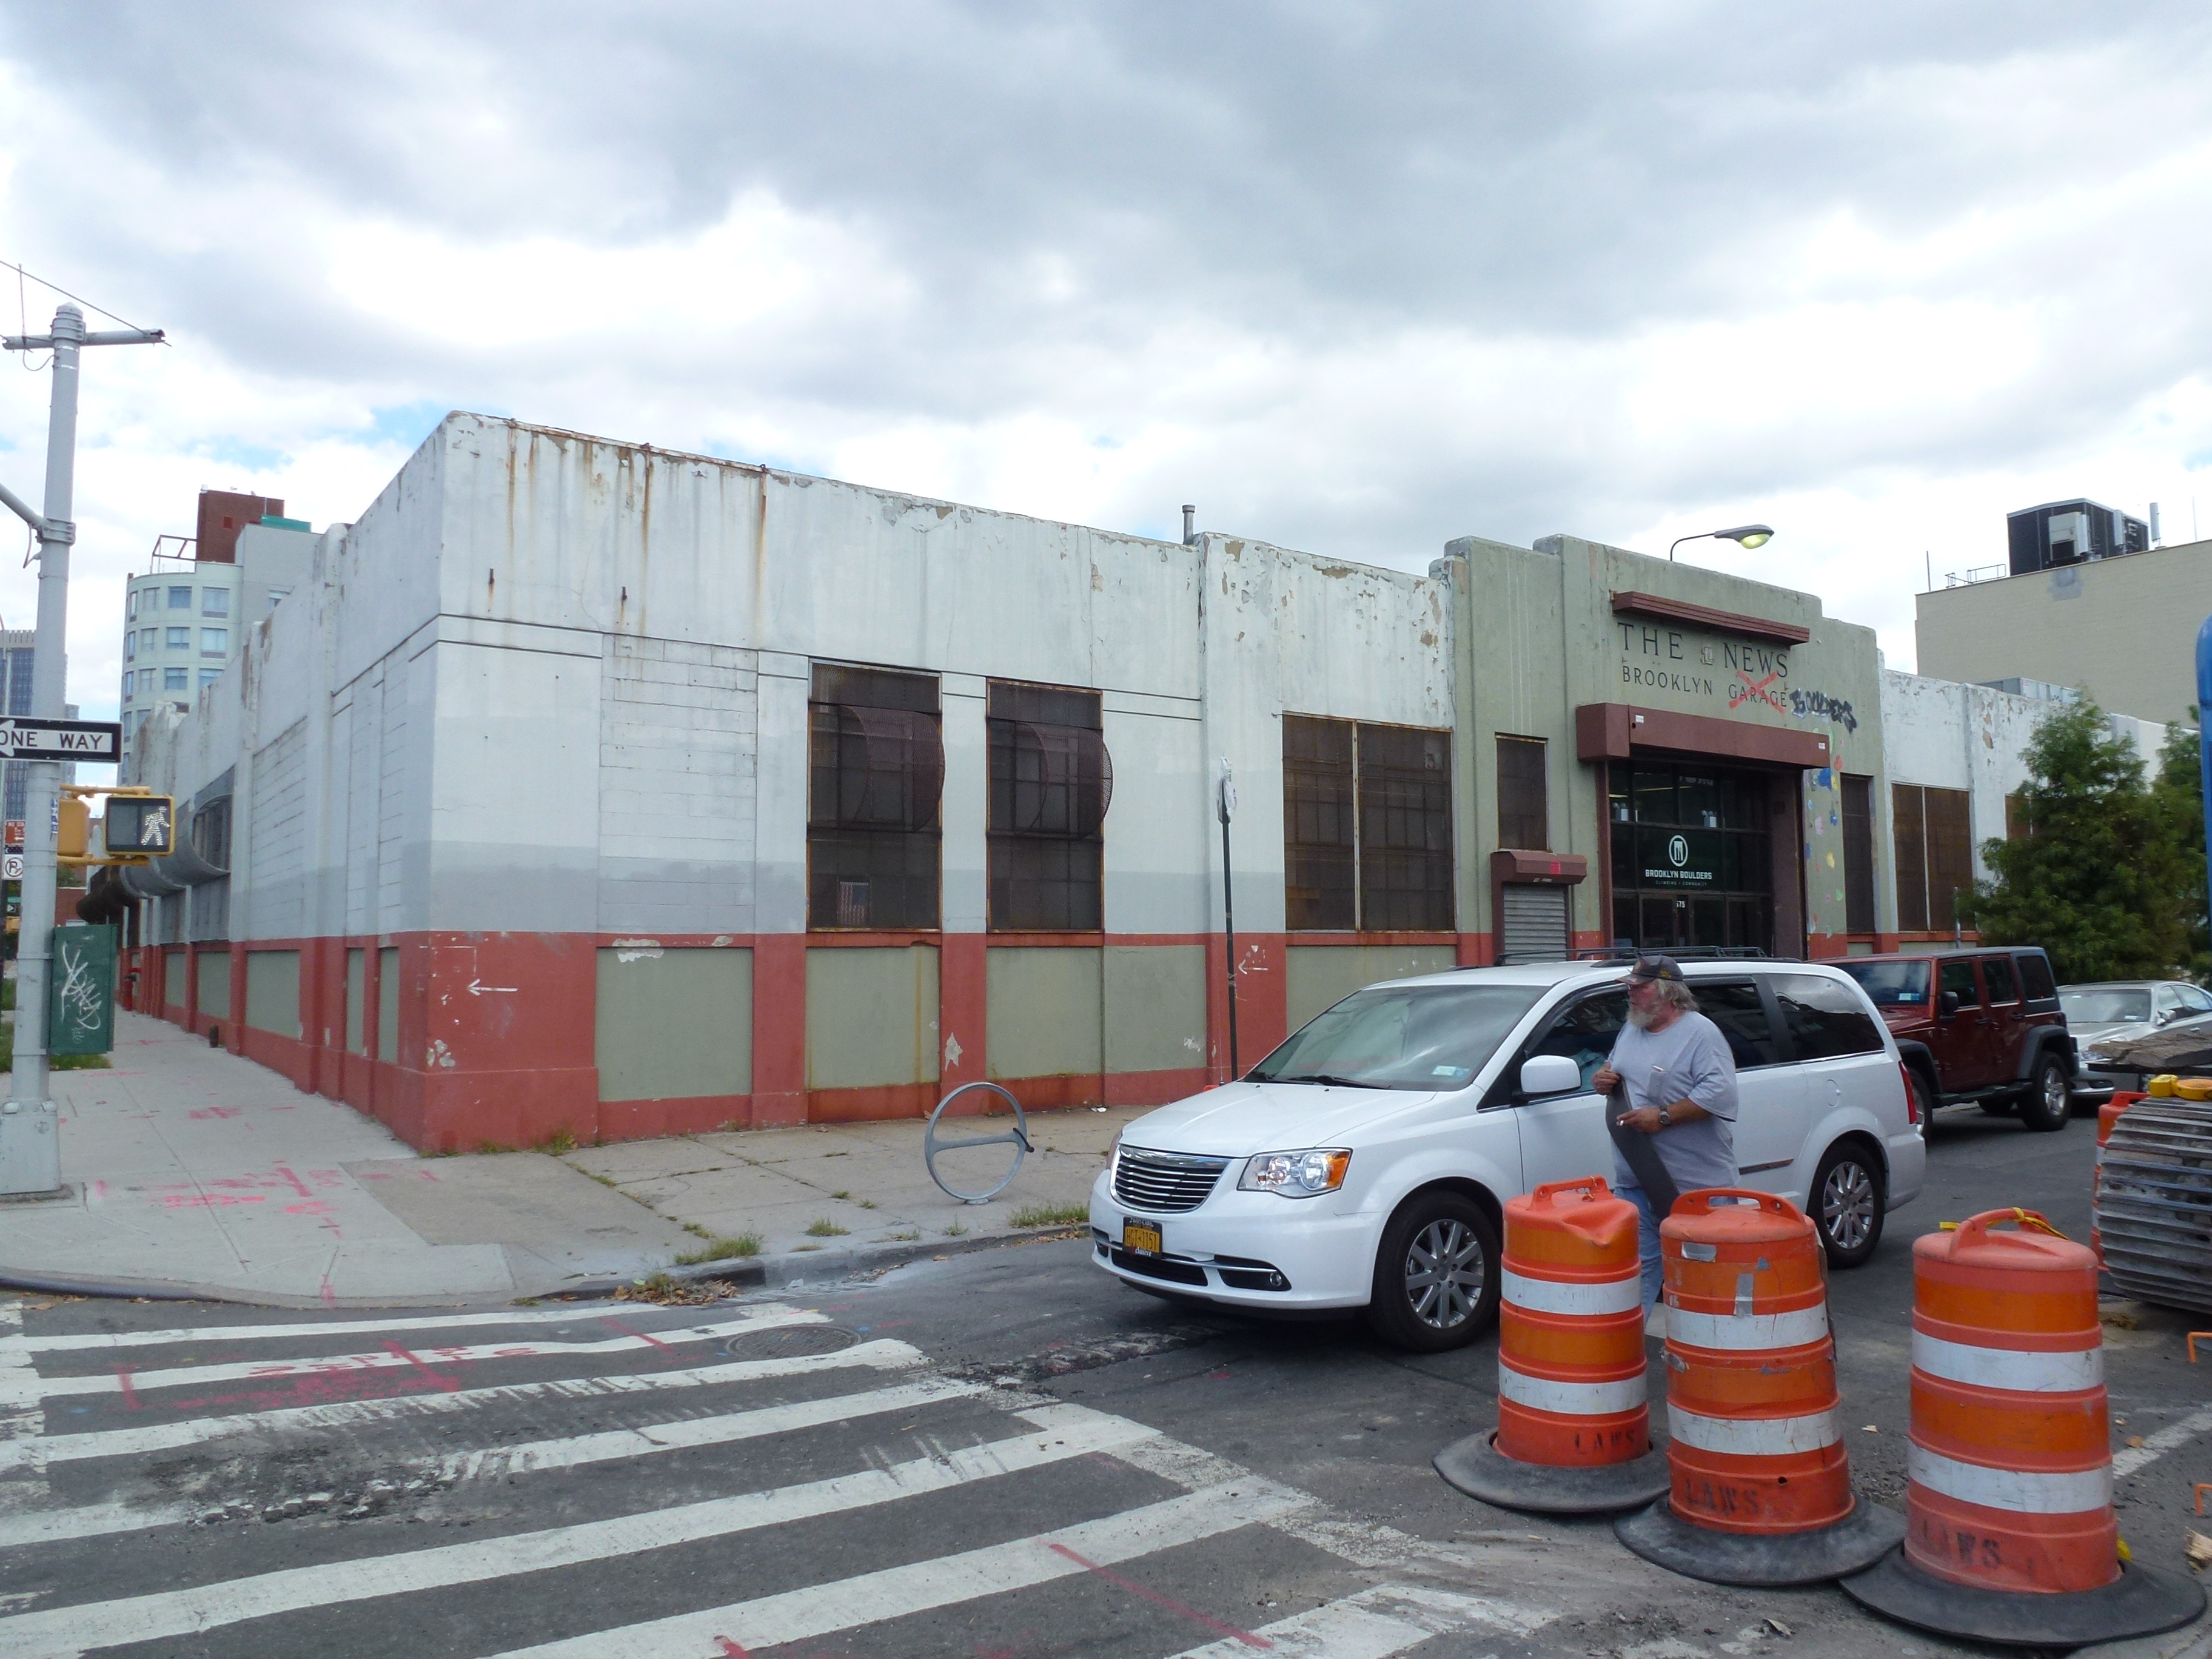
Brooklyn News Building, September 2016
More recently, some areas in Gowanus emerged as clusters of certain activities such as gyms, climbing walls, and other type of exercise-related activities. Degraw Street, for example, became a street which attracted uses focused on physical activities. These buildings used to house industrial uses, and their open floor plans allowed for easy conversion. With the proposed land use changes in the Gowanus Neighborhood Plan currently underway, the Google Map Community Preservation Layer could help these business owners and local residents communicate the significance gyms hold in this changing neighborhood fabric for their neighborhood character.
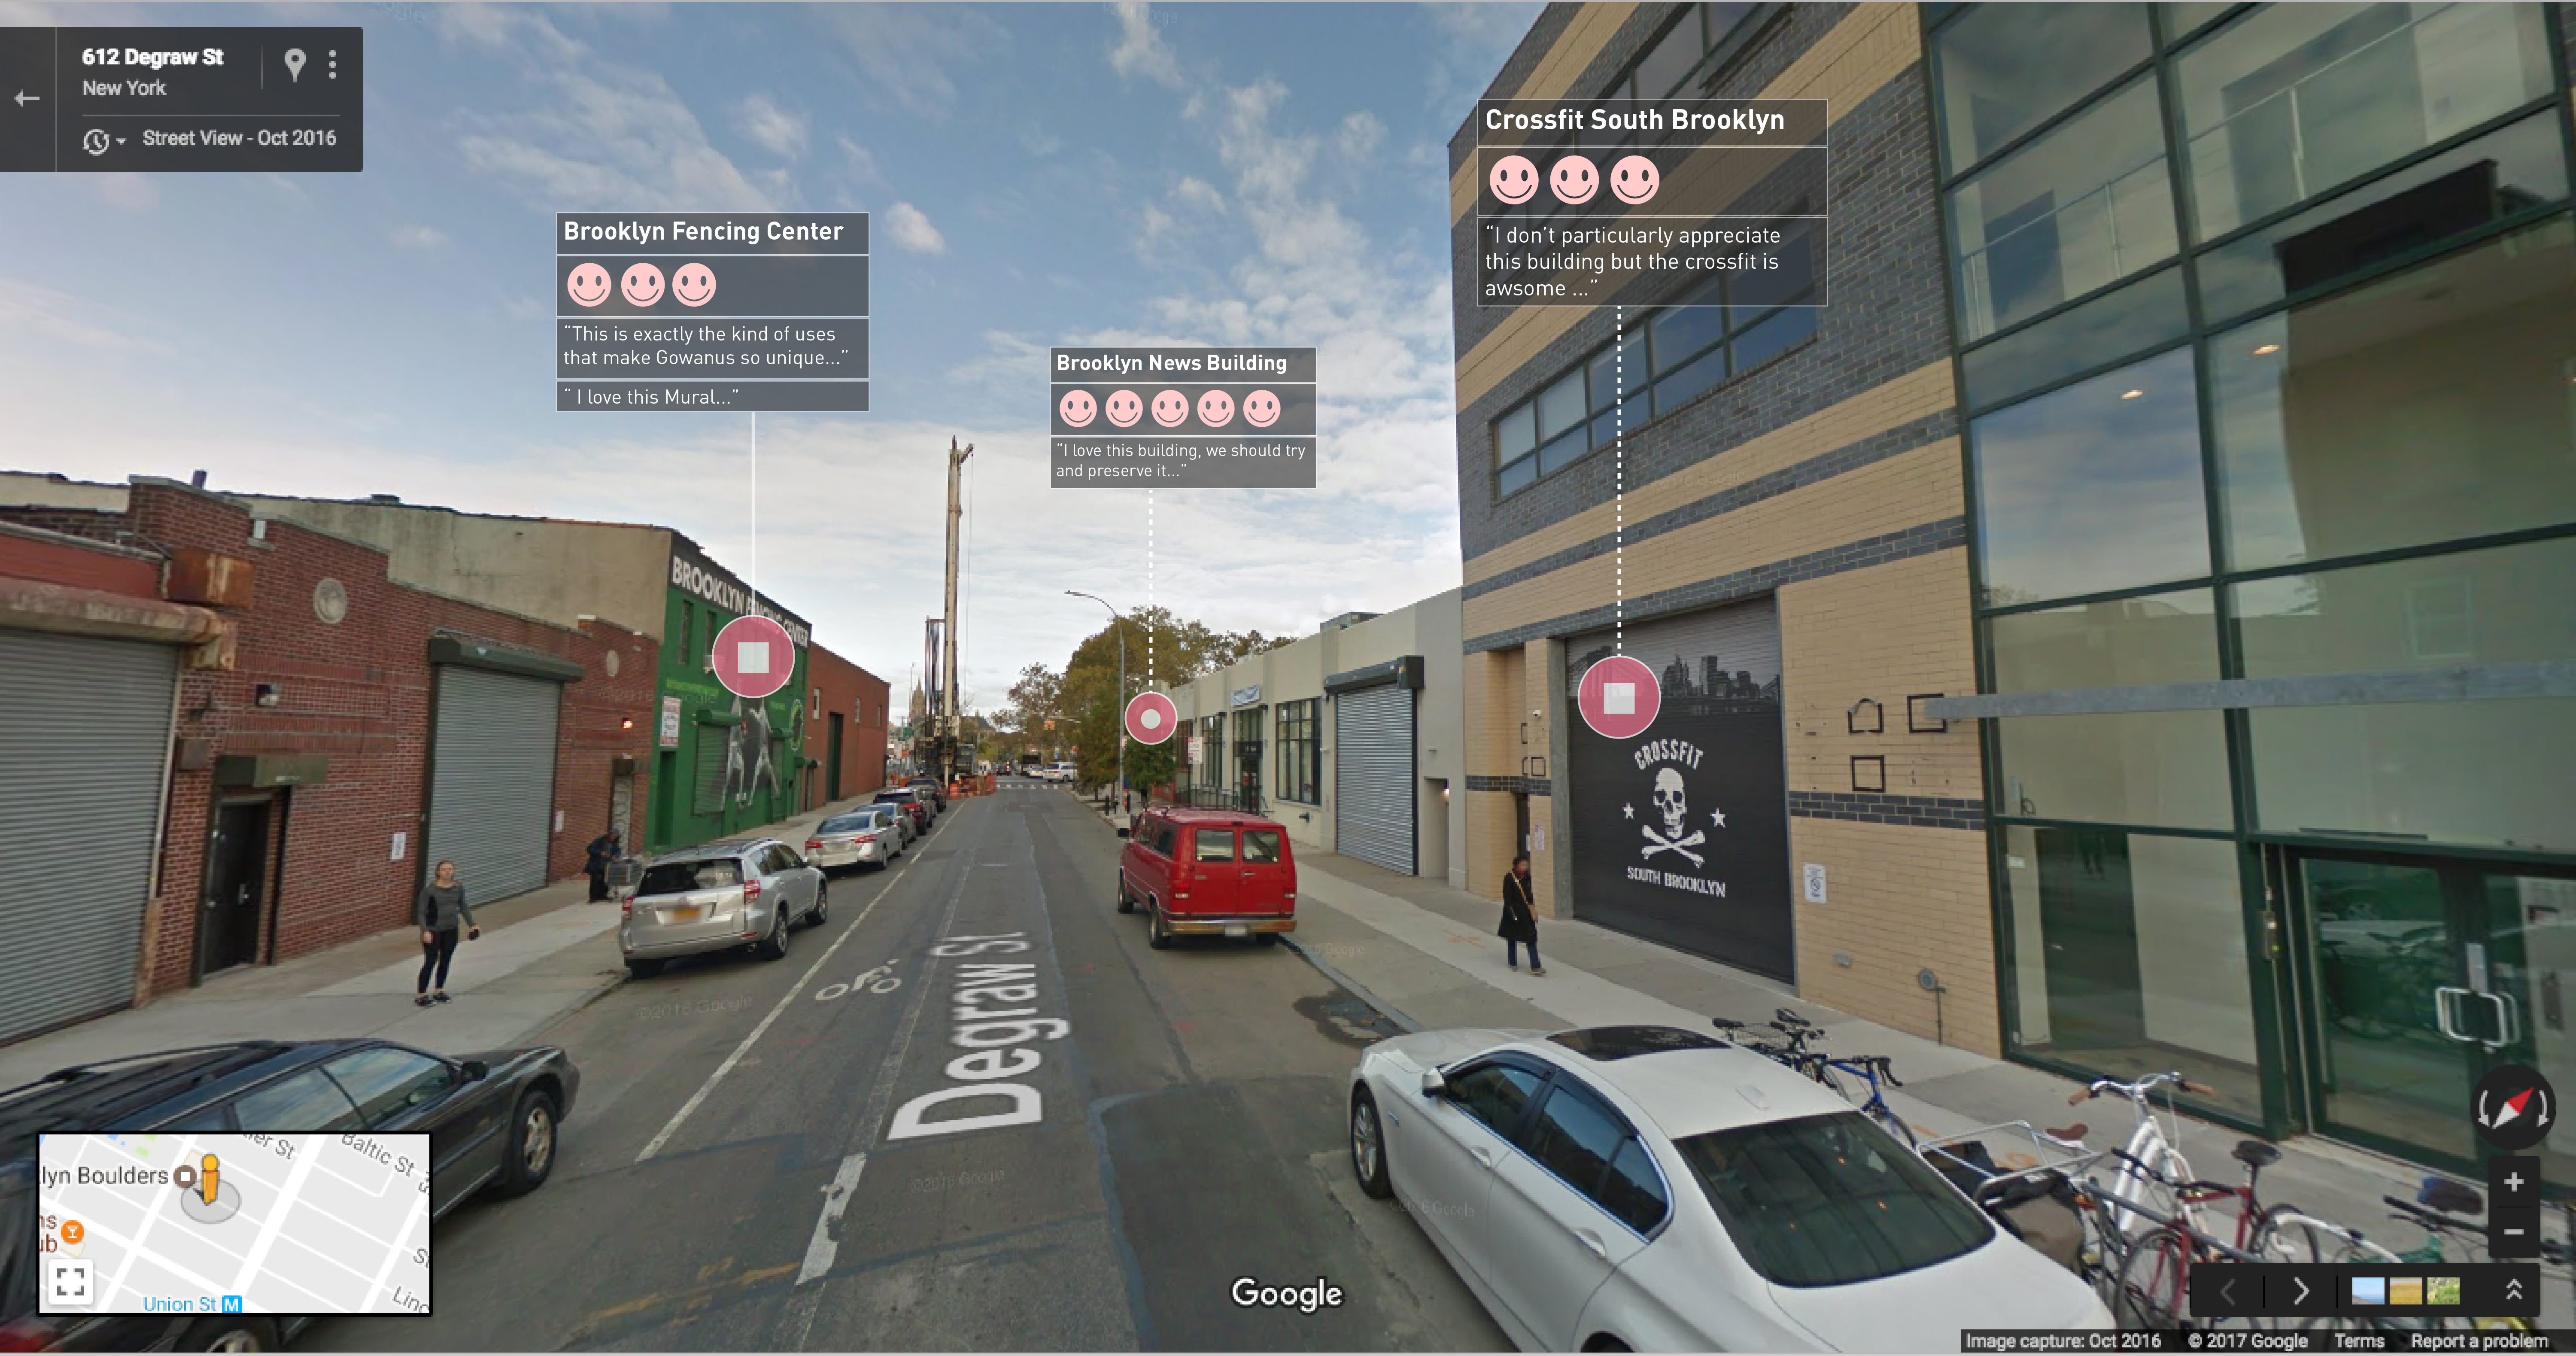
Degraw street view with a Community Preservation Layer on
The new visual identity could make it into the public realm and draw a connection from the online tool to local residents. This type of augmented reality helps inform all stakeholders of the significance of the place and help them participate in the consultation/preservation process.
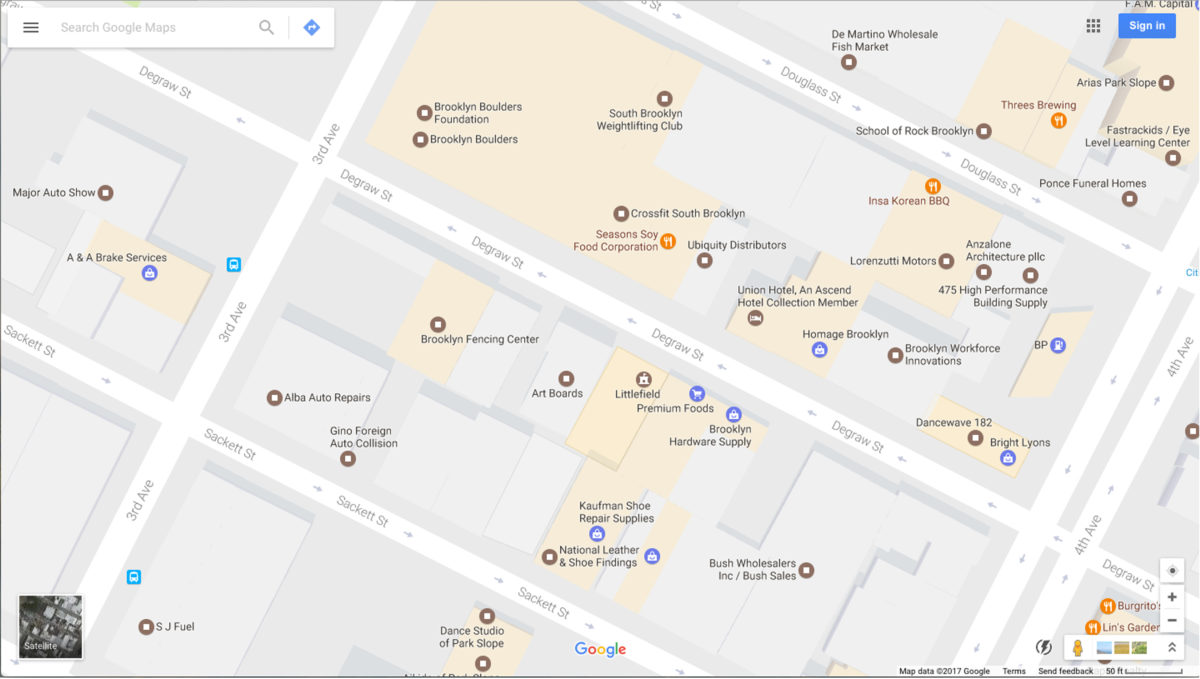
Existing Screenshot: Google Maps showing the area of Degraw Street as shown today illustrative the cluster of uses highlighted in beige
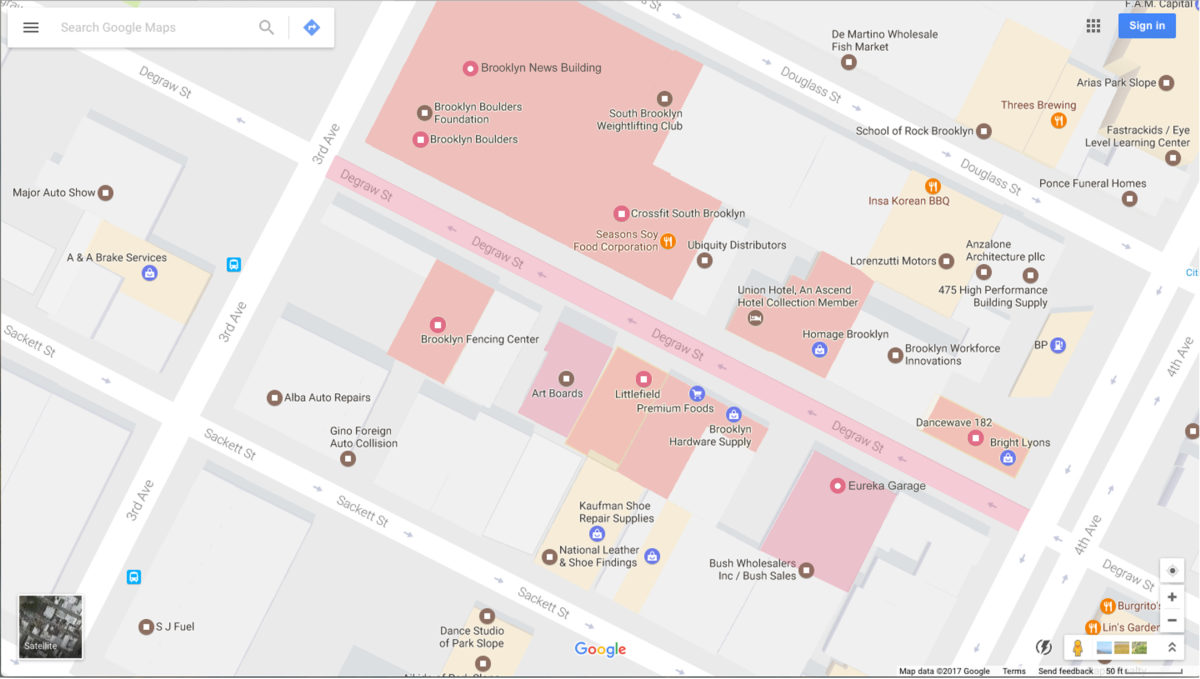
Google Maps Community Preservation Layer on: The pink area shows the community preservation area of interest, through which community residents and others can see the specific questions or data prompts, and input their reviews and comments for particular buildings and uses
An agent of change for preservation
One of the main challenges in New York City’s changing landscape is dealing with both the negative aspects associated with change and the technical process involved in preserving the built environment. The Google Map Community Preservation Layer aims to bridge this divide, by making preservation an accessible process and allowing for a community-led process to influence development forces.
If we acknowledge that constant change is the city’s trademark, preservation becomes more complicated. Since the Google Map Community Preservation Layer is embedded into everyday life, it can be reshaped from the scale of the individual to the scale of whole neighborhoods. The Google Map Community Preservation Layer empowers citizens to identify those buildings and uses that they value most and wish to maintain, while at the same time creates enough content that developers and city officials could use to inform their planning processes.
However, The Google Map Community Preservation Layer can raise valid questions as to who are the users entering the data, how closely related are they to the community at question and at what point has an area of interest collected enough data to represent a collective choice. Another question raised is the potential for this data to be manipulated and used at the algorithmic level by Google or others.
Even though the tool might have drawbacks, having a tool such as this one could be especially useful at a time when a neighborhood is undergoing changes that might be perceived differently by the various neighborhood constituents. Today, when government agencies are constantly in search of innovative ways to engage communities, using this type of tool to empower community residents could allow for communities to be more involved in the planning and preservation processes and shape various development outcomes.
A New Kind of Hospital Room
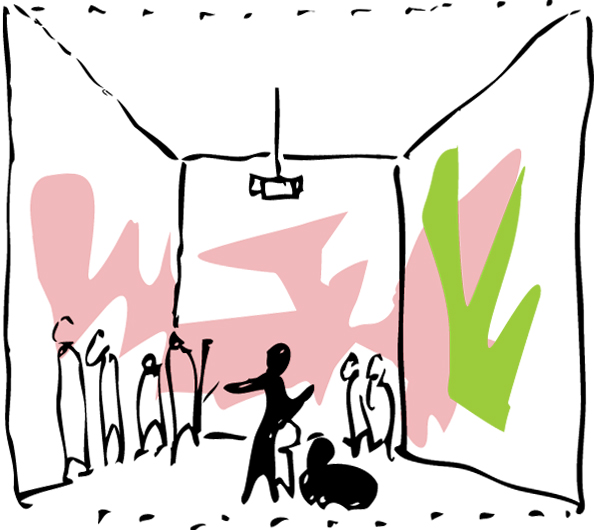
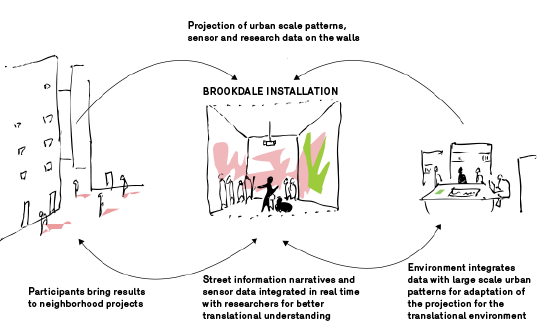
In the spring of 2017, Brookdale Hospital in Brownsville, Brooklyn, will unveil a new kind of hospital room: projections of key street scenes will unfold on the walls of the room along with a complex musical beat. The street scenes have been recorded by high risk participants; in this case, young men at risk for gang violence. Projections take viewers down the street at a walking pace while beats correlate with geospatial data streams, integrating factors like storefront occupation, pedestrian use, violence rate, and socioeconomic data. As participants take in the scene and follow this journey through their neighborhood projected on the walls of the hospital room, wearable sensors capture vital signs of anxiety in breath and heart rate. As anxiety increases in the room – such as when the scene approaches areas of illicit activity or rival territory – the video slows, eventually to a freeze frame, where participants are asked to relate to the scene with freestyle commentary.
This is also an opportunity for particularly skilled practitioners to mediate that anxiety through their artistic engagement practice. The project proposes a new kind of medicine based in the way people interpret their urban spaces. As various user and patient groups focus on and engage with key areas, the spatialized data compiled becomes a measurement of human value in the city.
This new paradigm of psychosocial medicine to be deployed in Brookdale has been precipitated by three shifts in contemporary technology:
- Shift from clinical studies of control based cause and effect to big data ecology and multivariable analysis
- Shift from machine learning and artificial intelligence computational systems to real time intelligent biophysical systems with embodied feedback in points of vulnerability
- Shift from treatment of individuals in imagined isolation to psychosocial therapy with a group in situ with collective imagination.
Although the installation at Brookdale is predicated on all three, the third shift is directly demonstrated in the project, intertwining the fields of medicine and urban design. With near instant feedback now available on an urban scale, it is increasingly important to develop rigorous methodologies that generate key psychosocial data streams in sensitive points of urban vulnerability as well as therapies that will manipulate those data streams in meaningful ways. This is the work of the Urban Rhythms studios.
Urban Rhythms Studios: In Brownsville from 2015 to the present
In Spring 2015, a group of 10 Brownsville youth presented a complex map of perceived risk due to potential gun violence in the Marcus Garvey Village (MGV) to Kenneth Frampton, the architect who designed the development 42 years prior. Over the course of ten weeks Ionna Jimenez and myself held discussions with the participants through the Brownsville Community Justice Center.
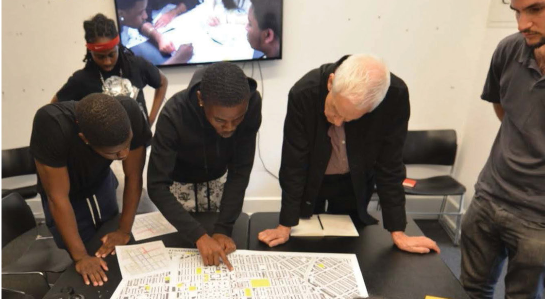
Jayquane and Myaliah explain their social architectures to designer Kenneth Frampton (Quardean Lewis)
Thanks to the forethought of coordinators Erica Mateo and Deron Johnston, Jimenez and myself were given complete freedom to discuss issues that the participants thought were most pressing: often circling back to the potential of violent confrontation with oppositional gangs. As a final project, each participant identified a spatial spectrum of perceived risk in night and day, on various days of the week, and at various times of the year. These maps were aggregated together, illustrating exactly how the peculiar architecture of the MGV effects the way people’s lives are lived on a daily basis. The maps become a topography of human perception, where physical spaces are assessed by their risk to materialize violence, intensified by one’s identification with the territory. The intimate cul-de-sacs or “mews” of the MGV offer particularly localized defensible spaces in which residents identify.
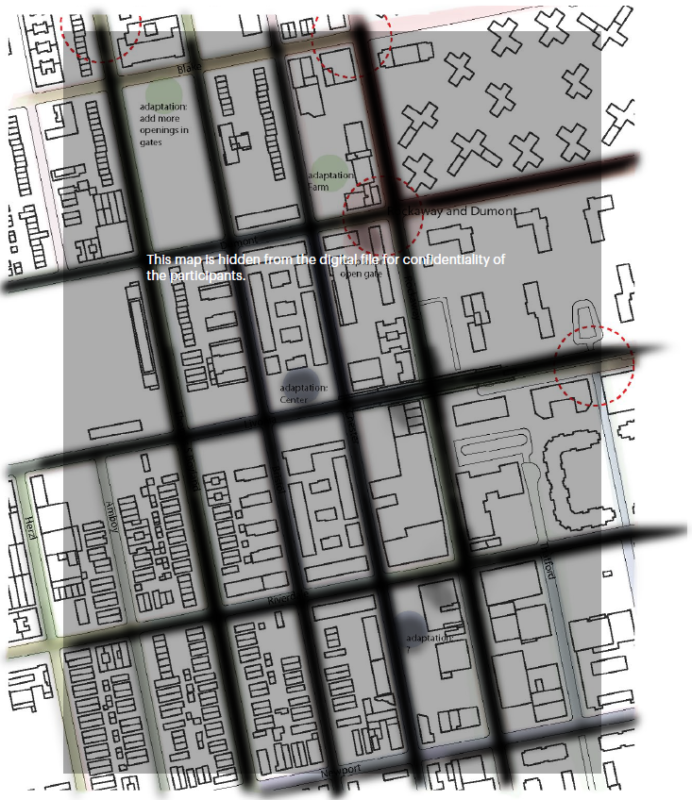 Whereas Frampton designed the MGV as an intimate departure in social housing from configurations of public space typified by the early 20th century Ville Radieuse and 19th century notions of cleansing air and light, the maps created by the young Brownsvillians offer a critique again – this time one in which a shifting real time chorography of perception begs for a kind of architecture that is a social choreography: a time based urban design that takes advantage of big data and adaptive management feedback in the living neighborhood system.
Along with the maps, we designed a recreation center, built in the Marcus Garvey Village in 2016 with the help of Tricia Martin and Kaja Kühl. The “built” space is less significant than the living landscape architecture envisioned by the group, a methodology that has implications for the way social problems are treated in general. This landscape architecture of psychosocial health presents a shift in the method of treatment of wrongdoing from punishing an individual in terms of their personal transgression, to creating collective therapies in psychosocial context.
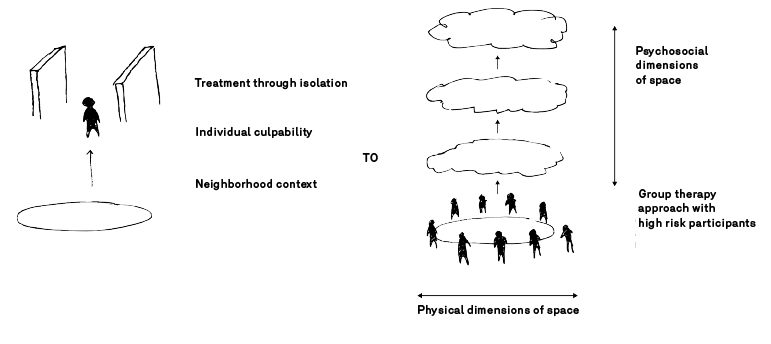
In the older framework, an individual transgressor may be on the receiving end of society’s externalities, or in other words the “deck may be stacked against him.” Because he has broken the law, the force of that law must come down equally upon him as it would on any other person anywhere. Enlightenment values of measurable equanimity are here transposed through harsh punishment as the transgressor becomes an example for society. He is made the picture of deviance reifying societal norms and rule of law. His body is removed and confined.
Rather than removal of the “problem” population, the psychosocial therapy methodology becomes a way to work with embedded human value tied to the street and its existing social networks.
What Urban Rhythms proposes is to address the culpability of the context. This context is created most directly by the people who live it, exemplified by the young people in the Marcus Garvey Village who face the risk of potential gun violence daily. Therefore, it is their collective imagination that has the highest likelihood of changing their lived landscape.
Real time data integration and practice: rapping and flexing
The method is not new. Urban Rhythms builds on collaborative strategies developed in existing Afro-American traditions of psychosocial therapy. In this project rapping and flex dancing are deployed in the institutional therapeutic setting of the hospital room as a psychosocial health urban design strategy.
Collaborator Tameel Marshall describes how the rapping environment plays with neighborhood data in terms of “beat,” “instrumentality,” and “lyricism.” Essentially time, scale, and meaning in practice:
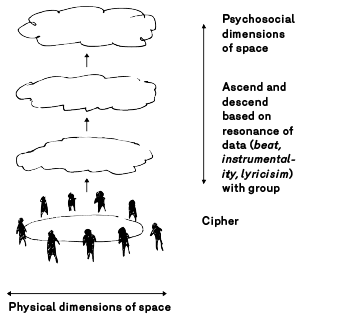 “Beat is the rate or the beats per minute, the metronome, breath, activity in a day, the ability for actions to take place, data, police phone calls, Facebook data, drop-out rate. It is the way slaves would communicate beyond words, the angle of perspective, the power of persuasion. It plays a big role in how something is perceived, whether a song captures the feeling of ‘the street.’
- Instrumentality is materials, tools, iron, guns, instruments, Google, Facebook, murals, stores, things they sell, garbage, chemicals, food, clothes, etc.
- Lyricism is meaning, criticism through ideas, words, and metaphors such as lies, African masks, images of the Vietnam war, desires to make it big and get out of Brownsville, etc.
For example, if murder rate is the beat in question then instrumentality is who died, where, and the murder weapon. Lyricism would be why the person died. Resonance is created when beat, instrumentality and lyricism connect with each other and connect to your soul.”
The word cipher is used by participants to describe this space that allows for the parsing of complex meanings and codes, in the moment, between various participants. The space and practice brings often contentious, high risk participants together for a collaborative synthesis. Collaborator Carl Belizaire describes how the flex dance cipher can resolve conflicts:
“If you have animosity towards someone and you see them on the dance floor, this is your time to go head to head. You will see people bump into someone they have beef within what they call a cipher, which is a space where everyone is huddled up and taking turns giving everything they have, and they bump into you and you then have no choice but to go, to show this person that you are the best at what you do. People will be upset but in the end it doesn’t matter because you are just taking care of whatever they had on their chest.”
Brookdale will be one of the first institutional hospital settings to deploy this psychosocial methodology. Because the very people who are most at risk in these spaces are also skilled in the methodologies of analysis, the hope is that participants will have the kind of skill and sensitivity that will reveal meaning layered in the streets of Brownsville and lead to adaptation of actions in their own lives on the street. Institutions offer the support and feedback that allows analysis to become actionable in urban systems.
Over time, these groups will be supplemented by other groups in the hospital room: beat police officers, social workers, even resident doctors; each group adding a layer of confidential meaning in neighborhood interpretation. As these data sets will then be folded back into the stream of video and beat, instrumentality, and lyricism, participating groups will hopefully see and understand ways they can adjust their own lives in the neighborhood to address risk and prevent violence and disease. These aggregated “songs” have another benefit; by revealing the complex poetic value tied to health data within the spatial gestalt of the city streets, these spatial songs are significant demonstrations of the value of the street and its living community, beyond socioeconomic or violence data in isolation.